

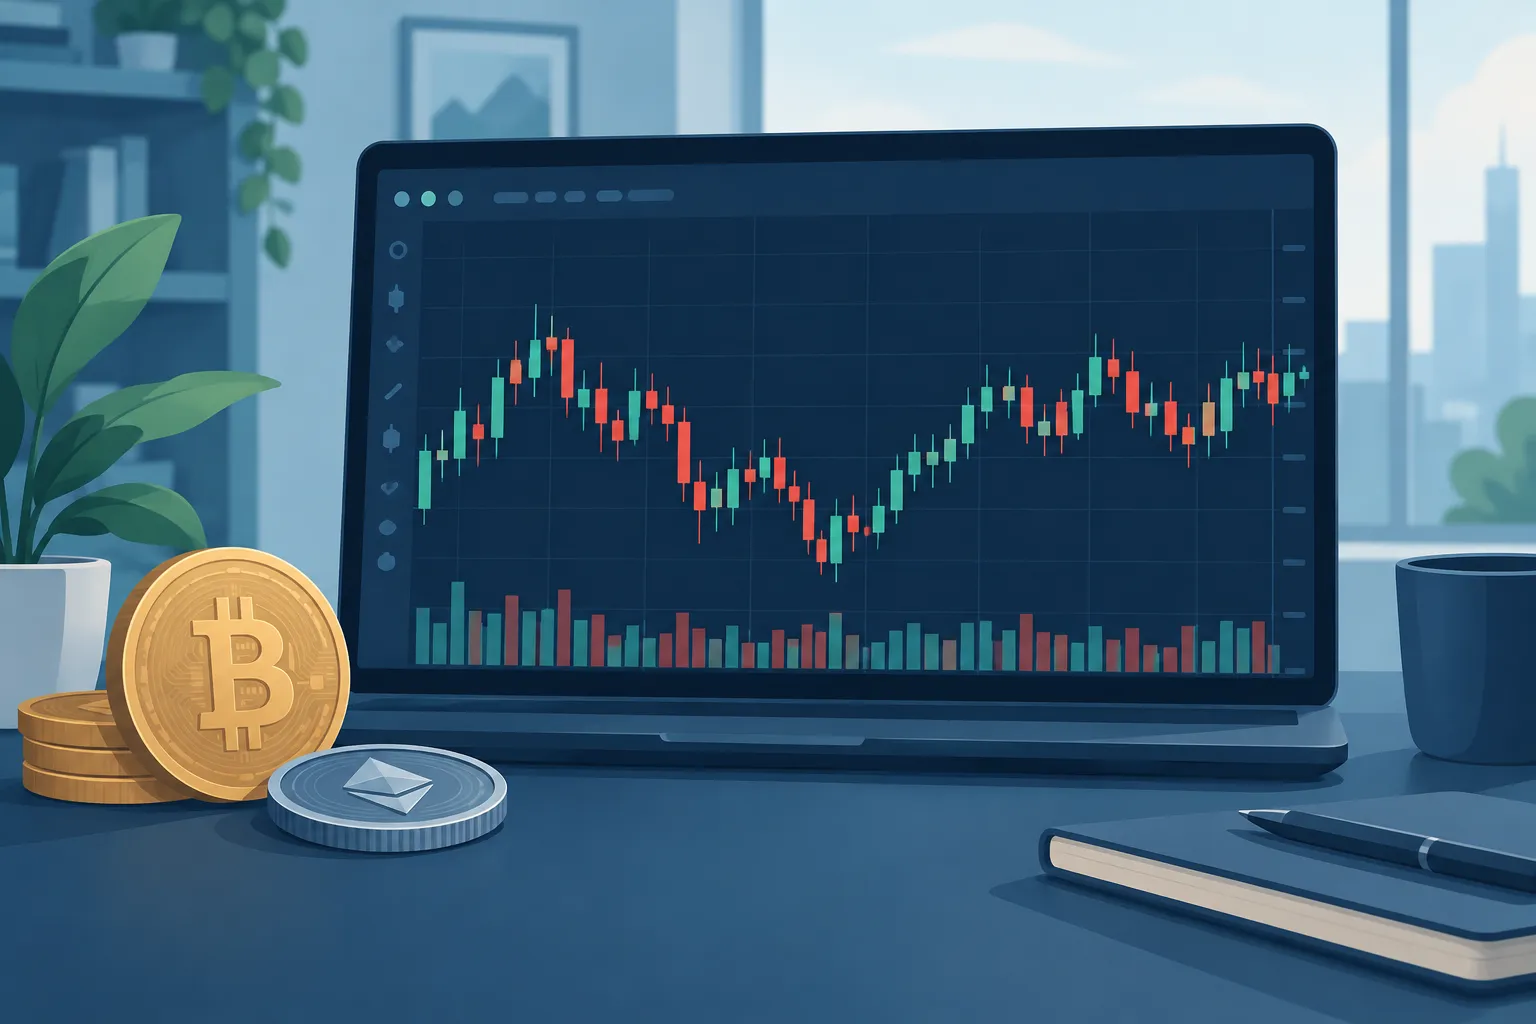
The candle’s body shows the distance between the opening and closing prices. Thin lines called wicks show the highest and lowest prices reached during that period. A green candle usually means the price closed above its opening price, while a red candle usually means it closed below. Colours can vary between trading platforms.
Candlestick charts help traders organise and visualise historical price movement. They do not predict future crypto prices with certainty.
Introduction
A crypto price chart can look confusing when you first open an exchange or trading app. The screen may contain red and green bars, thin lines, volume figures and several controls. Fortunately, the basic building block of many such charts is straightforward.
It is called a candlestick. Each candlestick gives you a compact summary of what happened to the price over a chosen period.
For example, one candle could represent one minute of Bitcoin trading. On another chart, one candle might represent one hour, one day or one week. The information shown by the candle follows the same basic structure, but the period covered changes.
Learning to read these candles can help you understand whether prices rose, fell or moved sharply within a period. It also makes it easier to compare recent price activity with earlier activity.
However, a chart is a record of market prices, not a promise about what will happen next. Crypto markets can be affected by liquidity, regulation, security incidents, global sentiment and many other factors that a candlestick alone cannot explain.
Understanding Crypto Candlestick Charts and OHLC Prices
A crypto candlestick chart is a type of financial chart made from a sequence of candles. Every candle summarises historical trading prices for one selected period, also known as the chart’s timeframe.
If you choose a 15-minute timeframe, each completed candle represents 15 minutes of price activity. If you choose a daily timeframe, each candle represents one day. A newly forming candle can continue changing until its period ends.
This timeframe matters. A large price movement on a one-minute chart may be only a small part of a daily candle. Before interpreting any candle, check the timeframe displayed by the platform.
Why do crypto traders use candlesticks?
A list of prices tells you individual numbers, but it may not show the shape of the market’s movement clearly. Candles place several useful pieces of information into one visual object.
At a glance, a trader can see:
- whether the period finished above or below its opening price;
- the highest and lowest prices reached during the period;
- the size of the move between the open and close; and
- how that period compares with nearby periods.
This makes candlestick charts useful for reviewing market activity. Traders may use them as one input when making decisions, but candles cannot reliably tell them what a cryptocurrency will do next. The same candle shape can appear in different market conditions and lead to different outcomes.
What do open, high, low and close mean?
The four prices inside a candle are known as OHLC. Here is what each term means in plain language.
- Open: The first traded price recorded when the selected period begins.
- High: The highest traded price recorded during that period.
- Low: The lowest traded price recorded during that period.
- Close: The final traded price recorded when the period ends.
For a candle that is still forming, the displayed close is generally the latest traded price rather than a final closing price. It can keep moving until the timeframe is complete.
OHLC values tell you the boundaries and endpoints of the period. They do not necessarily reveal the exact order of every price move inside it. For instance, a candle may show the same high and low whether the market reached the high first or the low first. You would need a shorter timeframe or more detailed trade data to examine that sequence.
The body and wicks of a candle
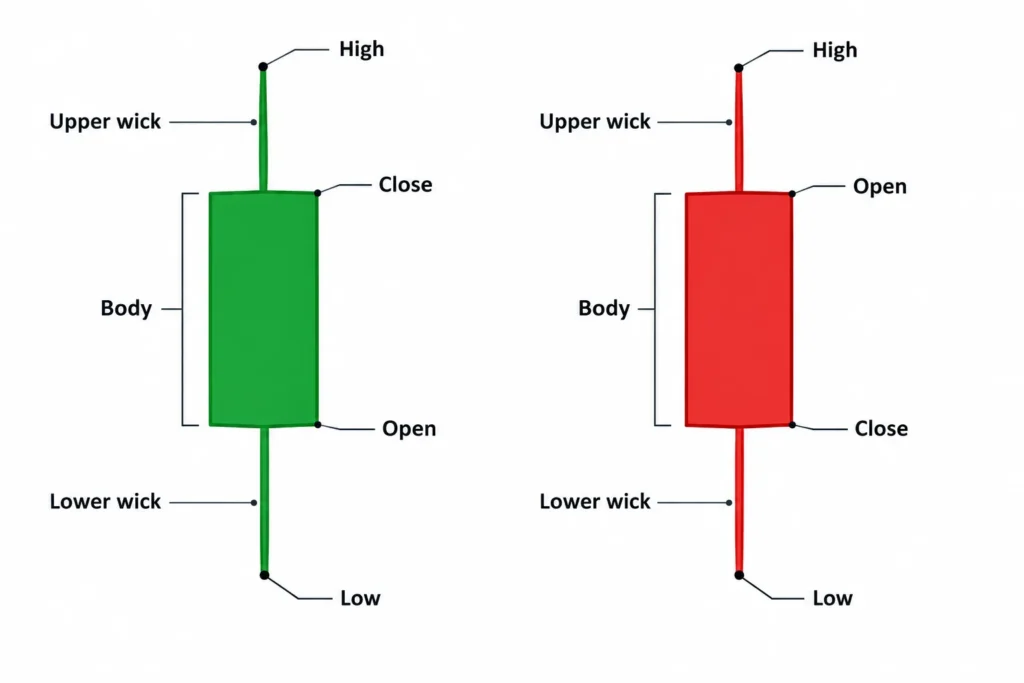
A candlestick has a body and may have an upper wick, a lower wick or both.
- Body: The thick section between the open and close. Its height shows how far the price moved between those two points.
- Upper wick: The thin line above the body. It extends towards the highest price reached during the period.
- Lower wick: The thin line below the body. It extends towards the lowest price reached during the period.
Some platforms call wicks “shadows”. Both terms describe the same parts of the candle.
High: ₹112
Close: ₹108
Open: ₹100
Low: ₹96
Upper wick
Body
Lower wick
Bullish and bearish candles
A candle is generally described as bullish or bearish by comparing its closing price with its opening price.
| Candle type | Price relationship | Common colour | Basic meaning |
|---|---|---|---|
| Bullish candle | Close is above open | Green | The price finished the period higher than it started. |
| Bearish candle | Close is below open | Red | The price finished the period lower than it started. |
Green and red are common conventions, but they are not universal rules. Some platforms use white for bullish candles and black for bearish candles. Others allow users to choose custom colours. Always check the chart settings instead of relying only on colour.
On a bullish candle, the open is at the bottom of the body and the close is at the top. On a bearish candle, the positions are reversed: the open is at the top of the body and the close is at the bottom.
The high remains the topmost price and the low remains the bottommost price in both cases.
A step-by-step rupee example
Assume a hypothetical crypto asset trades during a one-hour period with these OHLC prices:
- Open: ₹100
- High: ₹112
- Low: ₹96
- Close: ₹108
The candle opens at ₹100. At some point during the hour, the asset trades as high as ₹112 and as low as ₹96. It finally closes at ₹108.
Because ₹108 is higher than ₹100, this is a bullish candle. Under the common colour convention, its body would be green.
The body begins at the ₹100 opening level and ends at the ₹108 closing level. The upper wick runs from the top of the body at ₹108 to the period’s high of ₹112. The lower wick runs from the bottom of the body at ₹100 to the period’s low of ₹96.
The body therefore represents an ₹8 rise from open to close. The full candle range, measured from the ₹96 low to the ₹112 high, is ₹16. These figures describe what happened within that hour, but they do not establish what the next candle will do.
Timeframes, Common Patterns and Reading Candles in Context
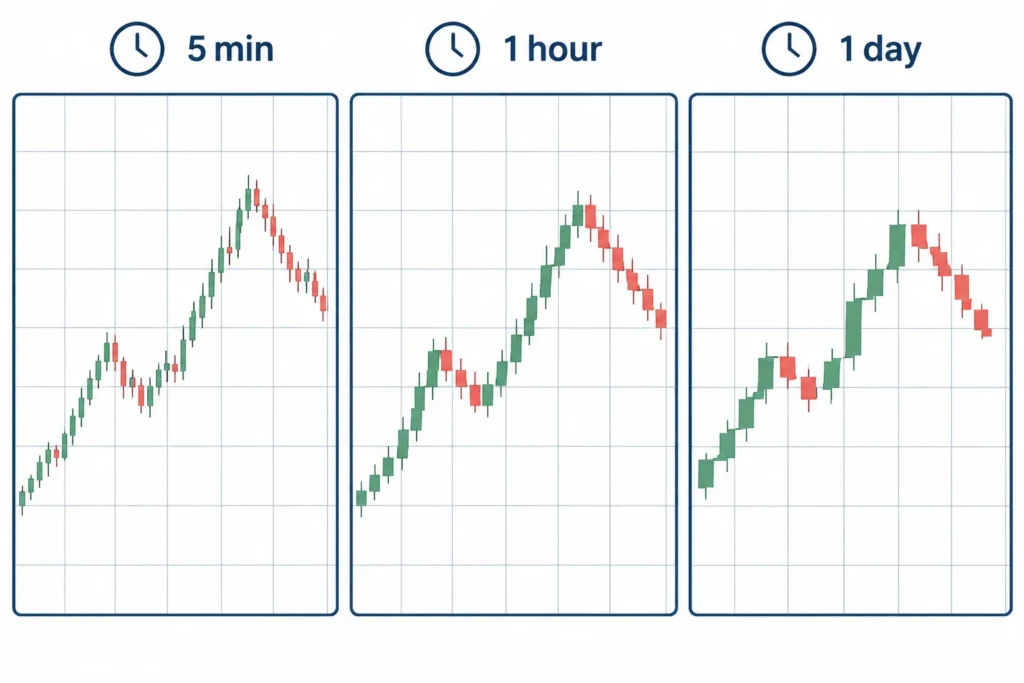
Crypto candlestick charts can show price activity over different periods. This period is called the timeframe. Each candle represents the opening, highest, lowest and closing price during the selected timeframe.
For example, on a 5-minute chart, every candle covers five minutes of trading. On a daily chart, each candle covers one full day. The underlying price activity may be the same, but changing the timeframe changes how much detail you see.
Common Candlestick Timeframes
| Timeframe | What each candle represents | Common use |
|---|---|---|
| 1-minute | One minute of price activity | Watching very small and rapid price moves |
| 5-minute | Five minutes of price activity | Short-term market observation |
| 1-hour | One hour of price activity | Following intraday price direction |
| 4-hour | Four hours of price activity | Viewing broader swings with less short-term noise |
| Daily | One day of price activity | Studying the wider market trend |
A 1-minute chart contains many more candles than a daily chart covering the same period. This provides more detail, but more detail does not always mean better information. Very short timeframes often contain substantial market noise: frequent price movements that may not reflect a meaningful change in direction.
Short charts can also encourage rushed decisions. A sudden red candle on a 1-minute chart may look alarming even though it is only a small pullback within a strong daily uptrend. Crypto prices can move quickly, so beginners should avoid treating every short-term candle as an instruction to act.
Higher timeframes usually provide a clearer view of the broader direction. However, they react more slowly and may hide smaller price movements. The appropriate timeframe depends on what you are trying to understand. Someone reviewing a crypto asset over several weeks may find the daily chart more useful than the 1-minute chart.
It can help to begin with a higher timeframe, such as the daily or 4-hour chart, and then look at a lower timeframe for additional detail. This approach keeps short-term movements connected to the wider picture.
Five Common Candlestick Patterns
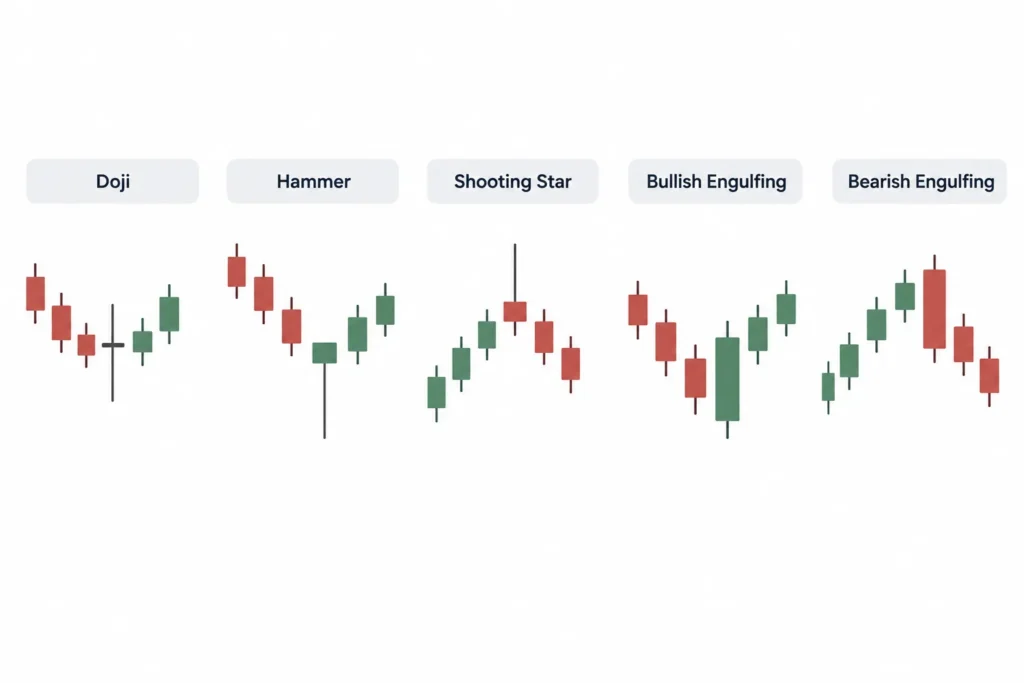
Candlestick patterns are recognisable candle shapes or combinations. Traders use them to organise price information and consider what buyers and sellers may be doing. Their conventional interpretations are possibilities, not predictions. No pattern is a certain buy or sell signal.
Doji
A doji forms when the opening and closing prices are the same or very close. Its body is therefore extremely small, although its upper and lower wicks may vary in length.
A doji conventionally suggests indecision. Buyers and sellers moved the price during the period, but neither side established clear control by the close. After a strong rise or fall, this may indicate that momentum is weakening.
However, a doji can also appear during ordinary sideways trading. It does not automatically mean that the price will reverse. Its location, trading volume and the candles that follow are important.
Hammer
A hammer has a small body near the top of its range, a long lower wick and little or no upper wick. It is usually discussed when it appears after a price decline.
The long lower wick shows that sellers pushed the price down, but buyers managed to bring it back towards the opening level before the candle closed. This is conventionally treated as a possible bullish reversal sign.
A hammer appearing near an established support area may attract more attention than one appearing randomly in the middle of a range. Even then, it does not confirm that prices must rise. Traders often wait to see whether later candles support the interpretation.
Shooting Star
A shooting star has a small body near the bottom of its range and a long upper wick. It is generally considered relevant after a price rise.
The upper wick suggests that buyers pushed the price higher but could not maintain that level. Sellers then moved the price back down before the close. The conventional interpretation is a possible bearish reversal.
As with a hammer, location matters. A shooting star near a known resistance area may be more meaningful than the same shape during irregular sideways movement. It remains a warning of a possible change, not proof that a fall will follow.
Bullish Engulfing Pattern
A bullish engulfing pattern uses two candles and is usually watched after a decline. The first candle is bearish. The second is bullish, with a real body that covers or “engulfs” the real body of the first candle.
This pattern suggests that buying pressure became stronger than selling pressure during the second period. Its conventional interpretation is a possible move upwards or a bullish reversal.
The pattern may deserve more attention if it forms near support and is accompanied by stronger trading volume. But one bullish engulfing pattern cannot establish that an extended rally has begun.
Bearish Engulfing Pattern
A bearish engulfing pattern is the opposite. It usually appears after a rise. The first candle is bullish, while the following bearish candle has a body that engulfs the first candle’s body.
This indicates that sellers took control during the second period. It is conventionally interpreted as a possible bearish reversal or the beginning of a pullback.
A bearish engulfing pattern near resistance may provide useful context. Nevertheless, crypto markets can recover quickly, and the pattern is not a guaranteed signal to sell.
Read Patterns Within the Broader Trend
The same candle pattern can mean different things in different market conditions. A hammer during a broad uptrend may simply mark the end of a small pullback. A hammer during a prolonged decline may suggest a possible reversal, but it could also fail as selling continues.
Before drawing a conclusion from crypto candlestick charts, consider whether the market is generally:
- Moving upwards, with higher highs and higher lows.
- Moving downwards, with lower highs and lower lows.
- Trading sideways within a range.
Patterns that agree with the broader trend are often easier to interpret. A single candle that conflicts with a strong trend requires particular caution.
Check Support and Resistance
Support is an area where buying interest has previously been strong enough to slow or stop a decline. Resistance is an area where selling pressure has previously slowed or stopped a rise.
A pattern forming near one of these areas may be more relevant. For example, a hammer near support could show that buyers are defending that price zone. A shooting star near resistance could indicate that buyers are struggling to push higher.
Support and resistance are usually zones rather than exact prices. They can also break. A pattern near a level should therefore be treated as one piece of evidence, not as confirmation of a future move.
Internal link note: Once the verified URL is available, link the relevant explanation above to “Crypto Support and Resistance Levels Explained”.
Consider Volume, Liquidity and Market Conditions
Trading volume shows how much of an asset was traded during a period. A pattern accompanied by unusually strong volume may indicate greater market participation. Low volume can make a price move less convincing, although volume alone cannot predict what happens next.
Liquidity also matters. A liquid market generally has more active buyers and sellers. In a thinly traded crypto asset, a few large orders may create dramatic candles and long wicks. These shapes can look important while mainly reflecting poor liquidity.
Relevant market conditions may include major regulatory announcements, exchange disruptions, token-specific developments or a sharp move in Bitcoin that affects the wider crypto market. Such events can quickly override an otherwise familiar candlestick pattern.
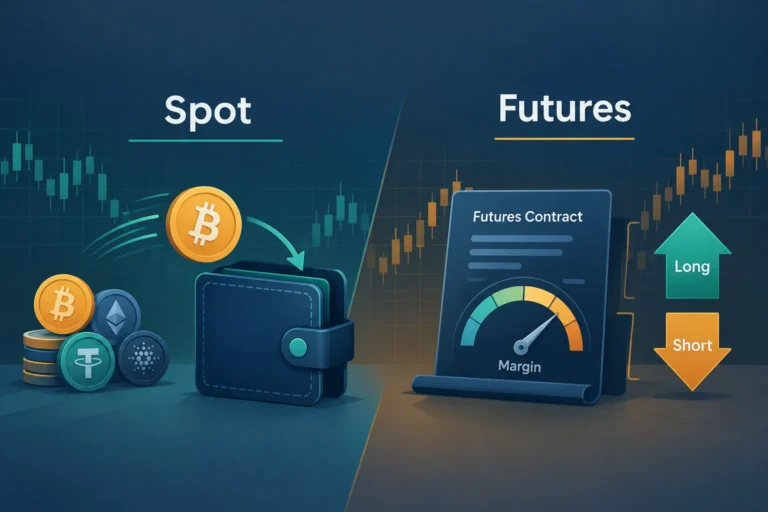
Leverage, futures and advanced indicators can add further information, but they also increase complexity and risk. Beginners do not need them to start reading candles. Focus first on timeframe, trend, key price areas, volume, liquidity and current market conditions.
The practical lesson is simple: recognise the pattern, but then ask where it appeared and what was happening around it. Crypto candlestick charts are most useful as a way to understand market behaviour in context, not as a source of certain trading instructions.
Beginner Mistakes, Responsible Use and FAQs
Crypto candlestick charts can make market activity easier to understand, but they can also create false confidence. A candle records what happened during a selected period. It does not tell you with certainty what will happen next.
Beginners should treat candlestick analysis as one limited source of information. It is not a complete trading strategy by itself. Market conditions, liquidity, risk management and your own financial situation also matter.
Common Mistakes When Reading Crypto Candlestick Charts
1. Assuming the Candle Colour Guarantees the Next Move
A green candle generally means the closing price was above the opening price. A red candle generally means the closing price was below the opening price. Neither colour guarantees the direction of the next candle.
For example, a large green Bitcoin candle may attract buyers who expect the rise to continue. However, early buyers may start selling to book profits. The next candle could then be red. Similarly, a red candle does not automatically mean that prices will keep falling.
Focus on what the candle confirms about the completed period, not what you hope it predicts.
2. Ignoring the Selected Timeframe
The meaning of a candle depends on the chart timeframe. On a five-minute chart, one candle represents five minutes of trading. On a daily chart, it represents one full day.
A strong green candle on a 15-minute chart may look important, but it could be only a small movement inside a larger downtrend visible on the daily chart. This is why two traders can study the same cryptocurrency and reach different conclusions if they use different timeframes.
Before interpreting any candle, check the timeframe shown on the chart. Beginners can also compare more than one timeframe. A higher timeframe may provide broader context, while a lower timeframe shows short-term price movements.
3. Relying on a Single Pattern
Recognising a hammer, doji or engulfing pattern is not enough to justify a trade. A pattern can fail, especially when it appears without supporting context.
Consider where the pattern appears. A possible reversal pattern near a previously tested price area may deserve more attention than the same formation in the middle of an unclear market range. Traders may also examine trading volume, the wider trend and nearby support or resistance areas.
Even when several factors appear to agree, the outcome remains uncertain. Confirmation can improve the quality of analysis, but it cannot remove risk.
4. Overlooking Liquidity
Liquidity describes how easily an asset can be bought or sold without causing a large price change. Major crypto assets and widely traded pairs may have relatively deeper markets than newly listed or little-known tokens.
In a low-liquidity market, a small number of large orders can create unusually long candle bodies or wicks. A chart pattern may look meaningful even though it was caused by limited trading activity or one large transaction.
Low liquidity may also lead to wider gaps between buying and selling prices. You might not receive the price you expected when placing an order. Before acting on crypto candlestick charts, check whether the asset has regular trading activity on the platform you use.
5. Overtrading Every Signal
Charts produce a constant stream of candles, but not every candle requires action. Beginners may feel pressure to trade whenever they notice a familiar shape. Frequent trading can increase transaction costs, expose capital to more risk and encourage emotional decisions.
A written plan can help. It may define which market conditions you will consider, how much you are prepared to risk and when you will avoid trading. Choosing not to trade is also a valid decision when the chart is unclear.
6. Treating Historical Formations as Certain Predictions
Candlestick patterns are based on historical price behaviour. They can show how buyers and sellers reacted in similar situations, but market conditions change.
A formation that preceded a price rise in the past may fail during a major regulatory announcement, an exchange-related event or a sudden change in global market sentiment. Crypto markets operate continuously, and sharp moves can occur at any time.
Historical patterns should therefore be viewed as possibilities, not promises. Avoid statements such as “this pattern always works” or “the price must rise from here.”
Using Candlestick Analysis Responsibly
Crypto prices can move sharply within a short period. False breakouts and failed patterns are common, particularly on short timeframes and in less liquid assets. Leverage can make these risks more severe because even a relatively small adverse move may cause a large loss.
A cautious approach includes the following practices:
- Do independent research: Understand the crypto asset, its purpose and relevant risks instead of relying only on its chart.
- Set a risk limit: Decide in advance how much money you can afford to lose on a trade. Do not use funds needed for rent, loan payments, emergencies or other essential expenses.
- Plan before entering: Identify why you are considering the trade, what would make the idea invalid and how you may exit.
- Avoid excessive leverage: Borrowed exposure can magnify both gains and losses. It may not be suitable for beginners.
- Check the wider context: Review the broader trend, timeframe, liquidity, volume and important market developments.
- Keep records: A simple trading journal can help you review decisions, mistakes and costs without relying on memory.
- Control position size: A valid chart idea can still fail, so avoid placing too much capital in one position.
Risk controls do not guarantee a profitable result. Their purpose is to limit avoidable damage and encourage consistent decision-making. If a potential loss would cause financial or emotional distress, the position is probably too large.
Candlestick analysis also works better when separated from emotion. Fear can cause a trader to sell after a sharp fall, while excitement can lead to buying after a sudden rise. Pause before acting and check whether the decision follows your plan.
Frequently Asked Questions
What does one candlestick represent?
One candlestick represents price activity during the timeframe selected on the chart. It normally shows the opening price, highest price, lowest price and closing price for that period. A one-hour candle covers one hour, while a daily candle covers one day.
Are candlestick patterns accurate?
Candlestick patterns are not consistently accurate in every market situation. They may help traders organise price information and identify possible changes in buying or selling pressure. However, patterns can produce false signals and should be assessed with market context, liquidity, trend and risk controls.
Which timeframe should a beginner use?
There is no single best timeframe for every beginner. Very short timeframes can be noisy and may encourage frequent trading. Longer timeframes, such as four-hour or daily charts, may make broader trends easier to observe. The appropriate choice depends on your objective, available time and risk tolerance.
Whatever timeframe you choose, apply it consistently and check a higher timeframe for context. Avoid changing timeframes only to find a chart that supports a decision you have already made.
Are candlesticks always green and red?
No. Green and red are common default colours, but charting platforms may use white and black, blue and red, or customised colours. The important point is to understand which colour indicates a close above the opening price and which indicates a close below it. Check the platform settings instead of assuming.
Can candlestick charts predict crypto prices?
No chart can predict crypto prices with certainty. Crypto candlestick charts describe historical and current price behaviour. They may help identify trends, momentum, indecision or possible reversal areas, but unexpected events and changing market conditions can invalidate any interpretation.
Summary
Crypto candlestick charts are useful for viewing how price moved during a chosen period, but they should not be treated as a forecasting machine. Common beginner errors include trusting candle colour, ignoring the timeframe, relying on one pattern, overlooking liquidity, trading too often and assuming that historical formations must repeat.
Use candlesticks as one part of a wider decision-making process. Check the market context, research the asset independently, set clear risk limits and accept that false signals are unavoidable. A disciplined approach cannot guarantee returns, but it can help you avoid decisions based only on excitement, fear or a single chart pattern.
Educational Disclaimer
Crypto trading is risky and may result in substantial or complete loss of capital. Historical price movements and candlestick patterns do not guarantee future outcomes. This article is provided only for general educational purposes and is not financial, investment, tax or legal advice. Consider your financial circumstances and seek advice from a qualified professional where appropriate before making financial decisions.

Comments