


Important disclaimer: This guide is for education only and is not financial, investment, tax or legal advice. Crypto trading is highly risky and can lead to substantial or total loss of your money. Prices can change sharply, platforms can fail, and orders may not execute at the expected price. Check current Indian regulations, tax rules and platform terms before making any decision.
Quick Answer
Crypto trading means buying and selling digital assets to try to benefit from price movements. Common crypto trading strategies include short-term trading, swing trading and position trading. Traders may use market, limit and stop orders, but no order type removes the risk of loss.
Beginners should first understand trading pairs, liquidity, volatility, order books, fees and slippage. They should also avoid excessive trading, borrowed money and positions they cannot afford to lose. A strategy is only a set of rules; it does not guarantee profits.
Introduction
Crypto markets can appear easy to enter. An exchange app may allow you to place an order within minutes, and price charts move throughout the day. However, easy access does not make trading easy.
Unlike a bank deposit, crypto does not offer assured returns or capital protection. A token can rise quickly, fall just as quickly, or become difficult to sell. Technical problems, low liquidity, regulatory changes, cyber incidents and emotional decisions can add to the risk.
This guide begins with the basic structure of crypto trading. Understanding how the market works is more important than memorising chart patterns or copying trades from social media.
Crypto Trading Fundamentals, Approaches and Orders
How the Crypto Market Operates
Crypto markets generally operate 24 hours a day, seven days a week. Participants may trade from India, the United States, Europe and other regions at the same time. There is no single global opening bell or closing time.
Trading continues through weekends and public holidays, although access can be interrupted by exchange maintenance, internet problems, banking restrictions or technical failures. Some platforms may also pause deposits, withdrawals or trading in particular assets.
Crypto does not have one universal price. Each exchange has its own buyers, sellers and order book. The quoted price of a token can therefore differ slightly across platforms.
Price discovery happens when buyers and sellers place orders at prices they consider acceptable. If buyers become more aggressive, they may accept higher asking prices. If sellers are keen to exit, they may accept lower bids. The latest completed trade is often displayed as the current market price.
Crypto volatility can be high because sentiment changes rapidly, some assets have limited liquidity, and markets react to news, regulation, security incidents and large trades. Leverage and automated liquidations can make price moves sharper. Smaller tokens may be particularly unstable because fewer orders are available to absorb buying or selling.
Trading Versus Long-Term Investing
Trading and investing both involve risk, but they usually have different time horizons and decision-making methods.
| Factor | Crypto trading | Long-term crypto investing |
|---|---|---|
| Typical focus | Shorter-term price movements | Long-term adoption, utility and value |
| Holding period | Minutes, days, weeks or months | Often several months or years |
| Activity | Usually more frequent decisions | Usually fewer transactions |
| Main risks | Volatility, timing errors, fees, slippage and emotional trading | Long declines, project failure, custody risk and regulatory change |
Neither approach guarantees returns. Holding an asset for years does not make a weak project safe. Similarly, frequent trading does not create an automatic income. More trades can mean more fees, more taxable events and more opportunities to make mistakes.
Trading Pairs and Exchange Types
A trading pair shows which asset is being bought and which asset is being used for payment. For example, in a hypothetical BTC/INR pair, BTC is the base asset and INR is the quote currency. A displayed price of ₹50,00,000 would mean one BTC is quoted at ₹50,00,000 on that platform at that moment.
Not every platform supports direct rupee trading for every token. Some trades may use crypto-to-crypto pairs, such as ETH/USDT. Stablecoins can also carry price, issuer, liquidity and regulatory risks; their names should not be treated as a promise of safety.
A centralised exchange, or CEX, is operated by a company that manages the trading platform and usually holds customer assets or facilitates custody. It may offer rupee deposits, customer support and conventional order screens. Users depend on the operator’s security, solvency, systems and withdrawal policies.
A decentralised exchange, or DEX, generally allows trades through smart contracts and self-controlled wallets. It may not require the exchange to take custody in the same way, but users face risks such as incorrect wallet transactions, malicious tokens, smart-contract failures, network fees and limited support. Decentralised does not mean risk-free.
Essential Market Terms
- Liquidity: How easily an asset can be bought or sold without causing a large price change. Higher liquidity usually supports smoother execution, but it does not guarantee a specific price.
- Market capitalisation: The current token price multiplied by the circulating supply. It is a rough measure of market size, not the amount of cash invested in the asset or available for withdrawal.
- Trading volume: The value or quantity traded during a stated period. Volume figures can differ by platform and data provider.
- Volatility: The size and frequency of price changes. High volatility can create opportunities, but it also increases the chance of rapid loss.
Common Trading Approaches
Spot trading involves buying or selling the actual crypto asset for immediate settlement under the platform’s rules. It is different from trading futures or other leveraged derivatives. Spot trading still carries price, custody and platform risk.
Short-term trading may involve positions held for minutes or hours. It demands close attention, clear risk limits and an understanding of fees and slippage. Rapid trading can encourage impulsive decisions, especially after a loss.
Swing trading aims to capture a price movement lasting several days or weeks. A trader may look for a trend, breakout or reversal and define an entry, exit and loss limit in advance.
Position trading uses a longer horizon, potentially lasting weeks or months. It sits between very active trading and long-term investing, although the boundary is not fixed.
Beginners do not need to trade constantly. Waiting is also a decision. A smaller number of planned trades may be easier to review than continuous buying and selling driven by fear of missing out.
Market, Limit and Stop Orders
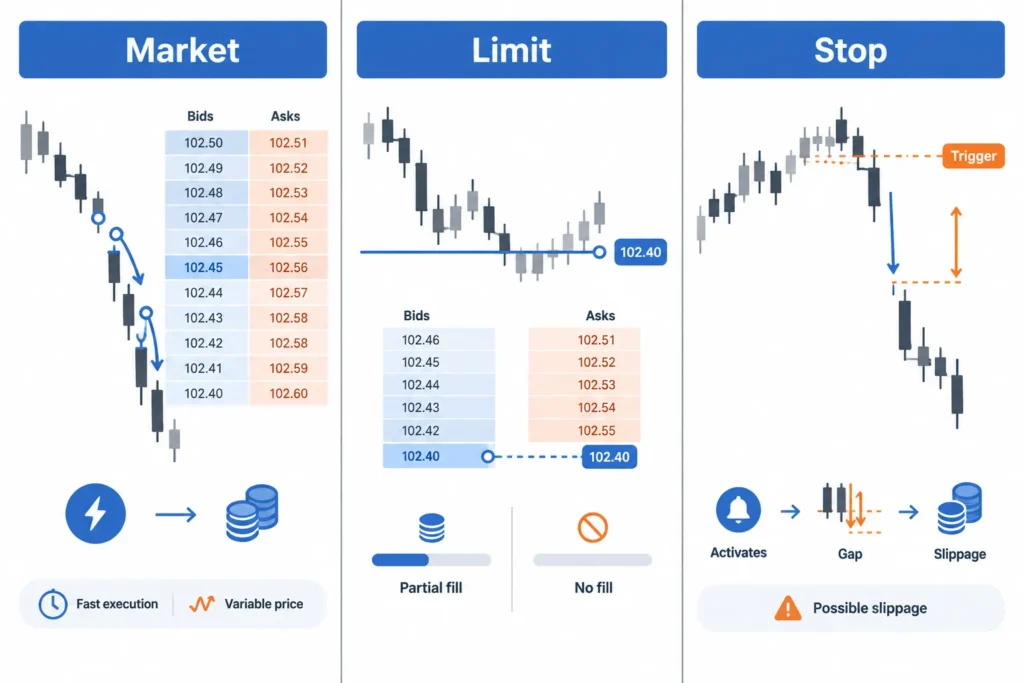
A market order asks the platform to execute immediately against available orders. It prioritises execution, not price. The final price can differ from the price shown when the order was submitted.
Educational example: Assume a trader places a market order to buy ₹10,000 of a token displayed at ₹100. If available sell orders are limited, portions might execute at ₹100, ₹101 and ₹103. The trader may receive fewer than 100 tokens before fees.
A limit order sets the highest price a buyer will pay or the lowest price a seller will accept. A buy limit at ₹95 should not execute above ₹95, subject to the platform’s mechanics. However, it may remain unfilled or only partly fill if sellers do not accept that price.
A stop order, where supported, becomes active after a specified trigger price is reached. A stop-market order may then execute at the available market price, which can be much worse than the trigger during a fast fall. A stop-limit order controls the limit price but may not execute at all.
Order names, triggers and execution rules vary across platforms. Some exchanges may not offer every order type for every pair. Traders should read the actual order description rather than relying only on a familiar label.
Order Books, Spreads and Slippage
An order book displays open buy and sell orders. Buy orders are called bids, while sell orders are called asks. The highest bid and lowest ask are usually the prices closest to a trade.
The difference between the best bid and best ask is the bid-ask spread. Suppose the highest bid is ₹99 and the lowest ask is ₹101. The spread is ₹2. A wide spread can increase the cost of entering and leaving a trade.
Slippage is the difference between the expected execution price and the actual average price. It is more likely during volatile periods, in low-liquidity assets or when an order is large compared with the available order book.
Educational example: A person wants to sell 500 tokens and sees a quoted price of ₹20. If only 100 tokens can be bought at ₹20 and the remaining bids are lower, the average sale price may be below ₹20. The proceeds may therefore be less than ₹10,000, even before fees and taxes.
No order has certain execution. Market orders can fill at an unfavourable price, limit orders can remain pending, and stop orders can experience gaps or slippage. Platform outages may also prevent a user from placing, changing or cancelling an order.
Publication check: Crypto products, order features, fees and execution rules vary by platform and can change. Indian regulations and tax treatment must also be checked before publication and before acting. Tax outcomes may depend on the transaction and the individual’s circumstances; consult a qualified professional where necessary.
Technical Analysis, Indicators and Research
Technical analysis studies price, trading volume and chart behaviour. Traders use it to identify trends, compare possible entry and exit points, and plan risk controls. It is a popular part of many crypto trading strategies, but it does not reliably predict what will happen next.
Crypto markets can move sharply because of news, low liquidity, leverage, security incidents or large orders. A chart records earlier trading activity; it does not reveal every reason behind that activity. Technical analysis should therefore be combined with fundamental research, liquidity checks and an assessment of project and security risks.
How to Read a Candlestick Chart
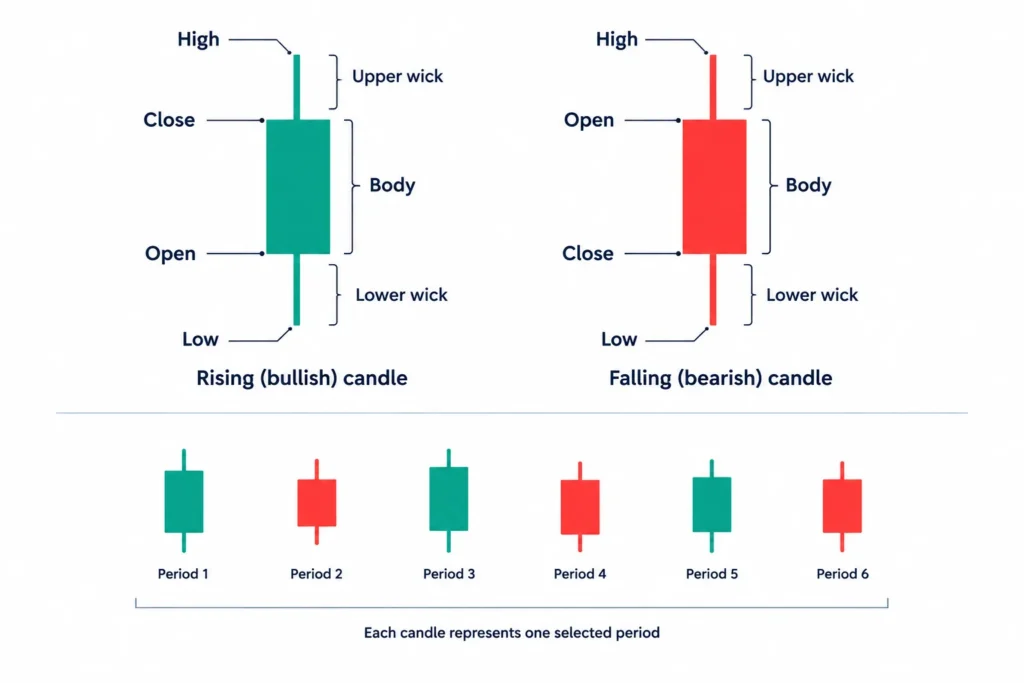
A candlestick summarises price movement over a selected period. Each candle contains four data points, commonly called OHLC:
- Open: The price at the beginning of the period.
- High: The highest traded price during the period.
- Low: The lowest traded price during the period.
- Close: The price at the end of the period.
The thick part of the candle is the body. Thin lines above and below it are often called wicks or shadows. A long upper wick may show that buyers pushed the price higher before sellers brought it down. A long lower wick may show the opposite. However, one candle by itself provides limited information.
The meaning of a candle also depends on the timeframe. On a one-hour chart, each candle represents one hour. On a daily chart, each candle covers one day. Short timeframes show more detail but can contain more market noise. Longer timeframes may make the broader direction easier to see, although their signals also arrive later.
A trader could use a daily chart to understand the wider trend and a four-hour chart to examine a possible trade. This does not remove uncertainty. Different timeframes can show conflicting conditions at the same time.
Trends, Support and Resistance
An uptrend generally contains a series of higher highs and higher lows. A downtrend generally contains lower highs and lower lows. When neither side controls the market clearly, price may move sideways within a range.
Support is an area where buying has previously increased or selling has slowed. Resistance is an area where selling has previously increased or buying has weakened. These are better treated as zones rather than exact prices.
For example, suppose a cryptoasset repeatedly falls towards ₹100 and then recovers. Traders may view the area around ₹100 as support. If the price repeatedly struggles near ₹125, that area may be treated as resistance. Neither level is guaranteed to hold. A large order, an exchange problem or unexpected news could push the price through it quickly.
A move above resistance is commonly called a breakout. A move below support is sometimes called a breakdown. Traders may look for higher volume or a successful retest of the level before acting, but false breakouts remain common.
Common Chart Patterns
Patterns such as triangles, channels, double tops, double bottoms, and head-and-shoulders formations are visual descriptions of past price behaviour. They may help traders organise observations and define possible scenarios.
They should not be treated as dependable forecasts. Two people can draw the same pattern differently, and a formation that appears clear in hindsight may have been uncertain while it was developing.
Educational scenario: Imagine that price forms lower highs while repeatedly finding support near ₹500. Some traders may label this a descending triangle and prepare for a move below support. Price could instead rise, remain range-bound or briefly break support before recovering. A sensible plan would define invalidation, position size and maximum acceptable loss rather than assume one outcome.
Moving Averages
A moving average smooths price data over a chosen number of periods. A 20-day simple moving average uses the closing prices from the latest 20 days. An exponential moving average gives more weight to recent prices.
Traders commonly interpret price above a rising moving average as evidence of positive momentum. Price below a falling average may suggest negative momentum. Some also watch for a shorter average crossing above or below a longer one.
Moving averages are lagging indicators because they are calculated from past prices. A long-period average may react slowly to a sudden reversal. A short-period average reacts faster but can produce frequent false signals in a sideways market. Changing the settings can also change the apparent signal.
Relative Strength Index
The Relative Strength Index, or RSI, is a momentum indicator. It compares the strength of recent upward and downward price moves and usually appears on a scale from 0 to 100.
Readings above 70 are often described as overbought, while readings below 30 are commonly described as oversold. These labels do not mean that price must immediately reverse. A strong uptrend can keep RSI elevated, and a strong downtrend can keep it low.
Traders may also compare RSI with price. If price makes a new high but RSI does not, this is called bearish divergence. If price makes a new low while RSI forms a higher low, it is called bullish divergence. Divergence can continue for a long time or fail completely, so it is not a standalone trading signal.
MACD
The Moving Average Convergence Divergence indicator, or MACD, compares exponential moving averages. It normally includes a MACD line, a signal line and a histogram showing the distance between them.
A MACD line crossing above the signal line may be interpreted as improving momentum. A cross below it may indicate weakening momentum. Traders may also watch whether the indicator is above or below its central line.
MACD is based on moving averages, so it also lags price. In a range-bound market, repeated crossings can create misleading signals. RSI might indicate stretched momentum while MACD still appears positive, or price might remain above a moving average while volume declines. Conflicting indicators are normal, not unusual.
Volume, Liquidity and Volatility
Volume measures how much of an asset was traded during a period. A price move accompanied by stronger volume may attract more attention than a move on weak volume. However, reported volume may differ across exchanges, and some activity may not represent genuine market interest.
Liquidity describes how easily an asset can be bought or sold without causing a large price change. A liquid market usually has a tighter gap between the best available buy and sell prices. In a thin market, even a modest order can cause slippage.
Volatility measures the scale of price movement. High volatility can create trading opportunities, but it also increases the chance that a position reaches its stop-loss or that execution occurs at an unfavourable price. Volume, liquidity and volatility provide useful context, but none can reliably tell a trader whether price will rise or fall.
Fundamental Research for Cryptoassets
Fundamental research asks what a project does, how it is operated and what risks could affect it. Start with project documentation, but remember that documents are written by the project team and may present an optimistic view.
Useful areas to examine include:
- Purpose and use: Whether the network or application addresses a clear need.
- Token supply: Current circulating supply, maximum supply and tokens that may enter the market later.
- Issuance: How new tokens are created and distributed.
- Tokenomics: The token’s utility, incentives, fees, staking structure and concentration among holders.
- Governance: Who can change the protocol and how decisions are made.
- Security: Smart contract risks, audits, administrator privileges and past incidents.
- Ecosystem: Developer activity, applications, users, integrations and dependence on a small number of partners.
A fixed maximum supply does not automatically create value. Demand, utility, holder concentration and unlock schedules also matter. Similarly, a high staking yield may come from new token issuance rather than sustainable economic activity.
Using On-Chain Data Carefully
Public blockchains can reveal wallet balances, transaction counts, fees and movement between addresses. Traders may study active addresses, network usage, exchange inflows, large-wallet activity or developer and ecosystem signals.
These metrics have important limits. One person can control many wallets, while one exchange wallet can represent thousands of customers. Transfers between wallets owned by the same organisation may look like new activity. Bots, airdrop campaigns and incentive programmes can inflate transaction counts.
Wallet attribution is also uncertain. An address labelled as belonging to an exchange, fund or large holder may be misidentified or may change purpose. Some transactions occur off-chain within centralised platforms and will not appear as individual blockchain transfers. Data may therefore be incomplete even when the blockchain itself is transparent.
On-chain activity can also be manipulated. A project may encourage low-value transactions to make usage appear stronger, and developers can copy code or make minor updates that inflate simple activity measures. Look for several independent indicators and question how each metric was constructed.
Before using any of these tools, readers should also review RegularStation’s published cryptocurrency risks guide for context on volatility, scams, custody, regulation and technology risk.
Use Technical Analysis as One Input
No indicator, pattern or blockchain metric removes uncertainty. Technical analysis can help structure a trade, but it cannot replace research into fundamentals, liquidity, token supply, security and project governance.
A beginner should avoid building a decision around one attractive chart signal. Check the broader trend, timeframe, trading volume, order-book conditions and relevant project developments. Then define the amount at risk and the condition that would show the original idea was wrong. The goal is not to predict every price move, but to make disciplined decisions when several outcomes remain possible.
Risk Management, Psychology, Advanced Risks and Learning Roadmap
Good risk management is more important than finding a “perfect” indicator. No technical setup works every time, and no crypto trading strategies can guarantee regular profits. A trader can be right about the general direction and still lose money because of poor timing, excessive position size, leverage or low liquidity.
Crypto prices can move sharply at any hour. Beginners should treat trading capital as money that could be lost completely. Never trade with borrowed money, emergency savings, rent money, education funds or money needed for near-term goals.
Control Position Size Before Entering a Trade
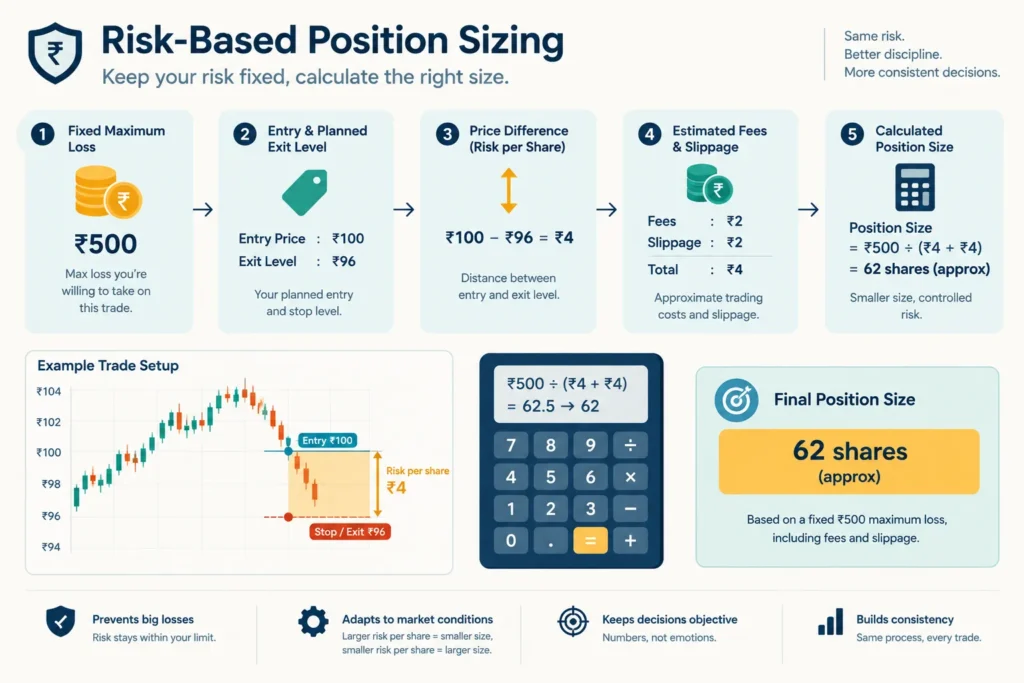
Position sizing means deciding how much money to put into one trade. It should be based on the loss you can tolerate, not on the profit you hope to make.
For example, suppose a learner has set aside ₹20,000 as high-risk learning capital. Putting the full ₹20,000 into one small token creates concentration risk. A sharp fall, exchange problem or scam could damage the entire amount. Using a smaller position limits the impact of one wrong decision.
A basic position-sizing process is:
- Decide the maximum rupee loss you can accept on one trade.
- Choose an entry price and a planned exit level if the trade goes wrong.
- Calculate the difference between the entry and exit prices.
- Reduce the position size if that difference creates a loss larger than your limit.
- Include trading fees, taxes, slippage and other applicable charges in your estimate.
A stop-loss level should not be chosen simply because it produces a larger position. It should have a logical connection to the trade idea, such as the breakdown of a support area. If the required stop is too far away, the safer response may be to use a smaller position or avoid the trade.
Diversification Has Limits
Holding several crypto assets may look diversified, but many tokens can fall together when the wider market weakens. Owning five highly correlated tokens is not the same as spreading money across genuinely different asset classes.
Diversification also does not remove exchange, custody, regulatory or technology risk. Beginners should avoid assuming that a large number of tokens automatically makes a portfolio safe. Each additional token also creates more research, record-keeping and monitoring work.
Use Risk-Reward Ratios Carefully
A risk-reward ratio compares the planned loss with the possible gain. If a trader is prepared to risk ₹500 to pursue a potential gain of ₹1,000, the planned risk-reward ratio is 1:2.
This ratio is only an estimate. The market may not reach the target, and the actual exit can be worse than planned. A seemingly attractive ratio does not make a poor-quality setup profitable. Results also depend on how often the method succeeds, execution costs and whether the trader follows the rules consistently.
Do not move a stop farther away merely to avoid accepting a loss. Doing so increases the amount at risk after the original trade idea has already weakened.
Understand the Limits of Stop-Loss Orders
A stop-loss is a risk-control tool, not an insurance policy. When the trigger price is reached, the order may be converted into a market order or handled according to the platform’s specific rules. The final execution price can be different from the trigger price.
This difference can be significant during:
- Sudden market crashes or sharp price spikes.
- Periods of poor liquidity and wide bid-ask spreads.
- Exchange outages, delayed order processing or technical failures.
- Price gaps between available orders.
- Rapid liquidations in leveraged markets.
A stop-limit order creates a different risk: the price may move through the limit without completing the order. Traders must understand the exact order types offered by their platform before using them.
Keep a Trading Journal
A trading journal helps separate evidence from memory. Without records, it is easy to remember successful trades and overlook repeated mistakes.
For each paper or real trade, record:
- Date, asset and market condition.
- Entry, stop and target.
- Position size and estimated costs.
- Reason for entering the trade.
- Actual exit and result.
- Whether the original rules were followed.
- Emotions felt before, during and after the trade.
- One lesson for the next trade.
Review a group of trades rather than judging a method from one result. A profitable trade may still involve poor discipline, while a controlled loss may reflect correct execution.
Manage FOMO, Fear and Greed
FOMO, or fear of missing out, often appears after a token has already risen quickly. A beginner may enter late because social media posts suggest that the opportunity will never return. If the price reverses, panic selling can follow.
Fear can also prevent a trader from following a reasonable plan. Greed may lead to oversized positions, unrealistic targets or refusal to take a planned exit. Loss chasing happens when a person takes increasingly risky trades to recover earlier losses quickly.
Overconfidence can develop after a few profitable trades, especially in a rising market. The gains may have resulted partly from favourable conditions rather than skill. Increasing position size too quickly can turn one mistake into a major loss.
Useful behavioural controls include:
- Write rules before opening the trading screen.
- Set a maximum daily or weekly loss limit.
- Take a break after a large gain or loss.
- Avoid trading when angry, anxious, sleep-deprived or under financial pressure.
- Do not enter solely because an influencer, celebrity or online group recommends a token.
Social media content may be sponsored, selective or designed to create hype. Screenshots of profits rarely show the person’s full trading history, losses or financial incentives. For further context, readers should consult RegularStation’s published guide about crypto scams. This internal reference must be linked only after the editorial team verifies the correct published page.
Leverage, Futures and Liquidation Risk
Leverage allows a trader to control a position larger than the money deposited as margin. It magnifies both gains and losses. A relatively small adverse price move can trigger liquidation, meaning the platform closes the position because the available margin is insufficient.
Futures and other derivative products may involve maintenance margin, mark prices, funding payments, expiry rules or contract-specific settlement methods. These features can affect results even when the trader’s broad market view is correct.
Platform interfaces can make leveraged trading appear simple, but the underlying contracts are complex. Liquidation systems may behave differently during extreme volatility. Beginners should avoid leverage until they fully understand the product, its charges, margin rules and worst-case outcomes. Avoiding leverage altogether is a reasonable choice.
Counterparty, Custody and Account Risks
Trading risk is not limited to price movement. Assets kept on an exchange may be exposed to hacking, withdrawal restrictions, operational failure, insolvency or legal action. A platform can fail even when a token’s market price is stable.
Self-custody removes some exchange exposure but introduces personal responsibility. Lost recovery phrases, incorrect transfers, malicious applications and compromised devices can cause irreversible losses. There may be no bank-like mechanism to reverse a mistaken blockchain transaction.
Protect accounts with unique passwords, app-based multi-factor authentication where available, withdrawal controls and carefully verified wallet addresses. Never share passwords, private keys, recovery phrases or one-time passwords.
RegularStation’s published guide about cryptocurrency risks should be placed as a separate contextual internal link here after its title, publication status and destination are verified. It should not duplicate the earlier crypto scams reference.
A Beginner Learning Roadmap
- Learn chart language: Understand candles, time frames, volume, trend, support, resistance and common order types.
- Observe different conditions: Study rising, falling, sideways, calm and highly volatile markets. A rule that appears useful in one condition may fail in another.
- Create hypothetical rules: Write specific entry, exit, position-size and loss-limit rules. Avoid vague instructions such as “buy when it looks strong.”
- Practise on paper: Record simulated trades without using real money. Include realistic fees and slippage rather than assuming perfect execution.
- Record results: Track both outcomes and rule-following. Use a meaningful series of observations instead of relying on two or three trades.
- Review errors: Identify late entries, oversized positions, emotional changes and misunderstood order types.
- Start small, if appropriate: Real money changes behaviour. If you choose to proceed, commit only an amount you can afford to lose entirely and do not use borrowed money.
Crypto Trading Safety Checklist
- I understand that no strategy is consistently profitable or guaranteed.
- I can afford to lose the entire amount committed.
- I am not using a loan, credit card balance or money needed for essential goals.
- I have written my entry, exit and maximum-loss rules.
- I understand that stop-loss execution can differ from the trigger price.
- I have checked fees, liquidity, custody arrangements and account security.
- I am not acting on hype, urgency or an influencer’s claim.
- I understand the product and will avoid leverage if I do not understand liquidation and margin rules.
- I will maintain records required for tax reporting.
Frequently Asked Questions
Can technical analysis guarantee profits in crypto trading?
No. Technical analysis organises price and volume information, but it cannot predict every market move. News, liquidity, regulation, platform failures and trader behaviour can invalidate a setup.
Is a stop-loss enough to protect my capital?
No. A stop-loss may reduce risk, but execution can occur at a worse price during sharp moves, gaps or poor liquidity. Position sizing and overall exposure remain essential.
Should beginners trade crypto futures?
Futures involve leverage, margin, liquidation and contract rules that can be difficult for beginners. Paper-based learning and unleveraged observation are safer starting points. A beginner may reasonably decide not to trade futures at all.
Can I use borrowed money if my strategy has worked before?
No. Past results do not ensure future performance. Borrowing adds repayment and interest obligations even if the trade loses money. Crypto trading should never be funded with borrowed money.
What should Indian readers check before trading?
Check the current legal and regulatory position, platform eligibility, tax treatment, transaction reporting, record-keeping duties and applicable charges. Rules and products can change. Consult a qualified tax, legal or financial professional where appropriate.
Summary
Responsible crypto trading strategies begin with small position sizes, realistic risk limits and written rules. Diversification has limits, stop-loss orders can slip, and leverage can lead to rapid liquidation. A trading journal can reveal whether results come from discipline, favourable market conditions or repeated emotional mistakes.
Before publication, an editor must fact-check all references to current exchange products, order features, futures terms, Indian regulations and tax considerations. This article is for education only and is not investment, legal or tax advice. Crypto trading can result in the loss of the entire amount committed. Consider professional advice based on your circumstances, and never trade with borrowed money.



Comments