

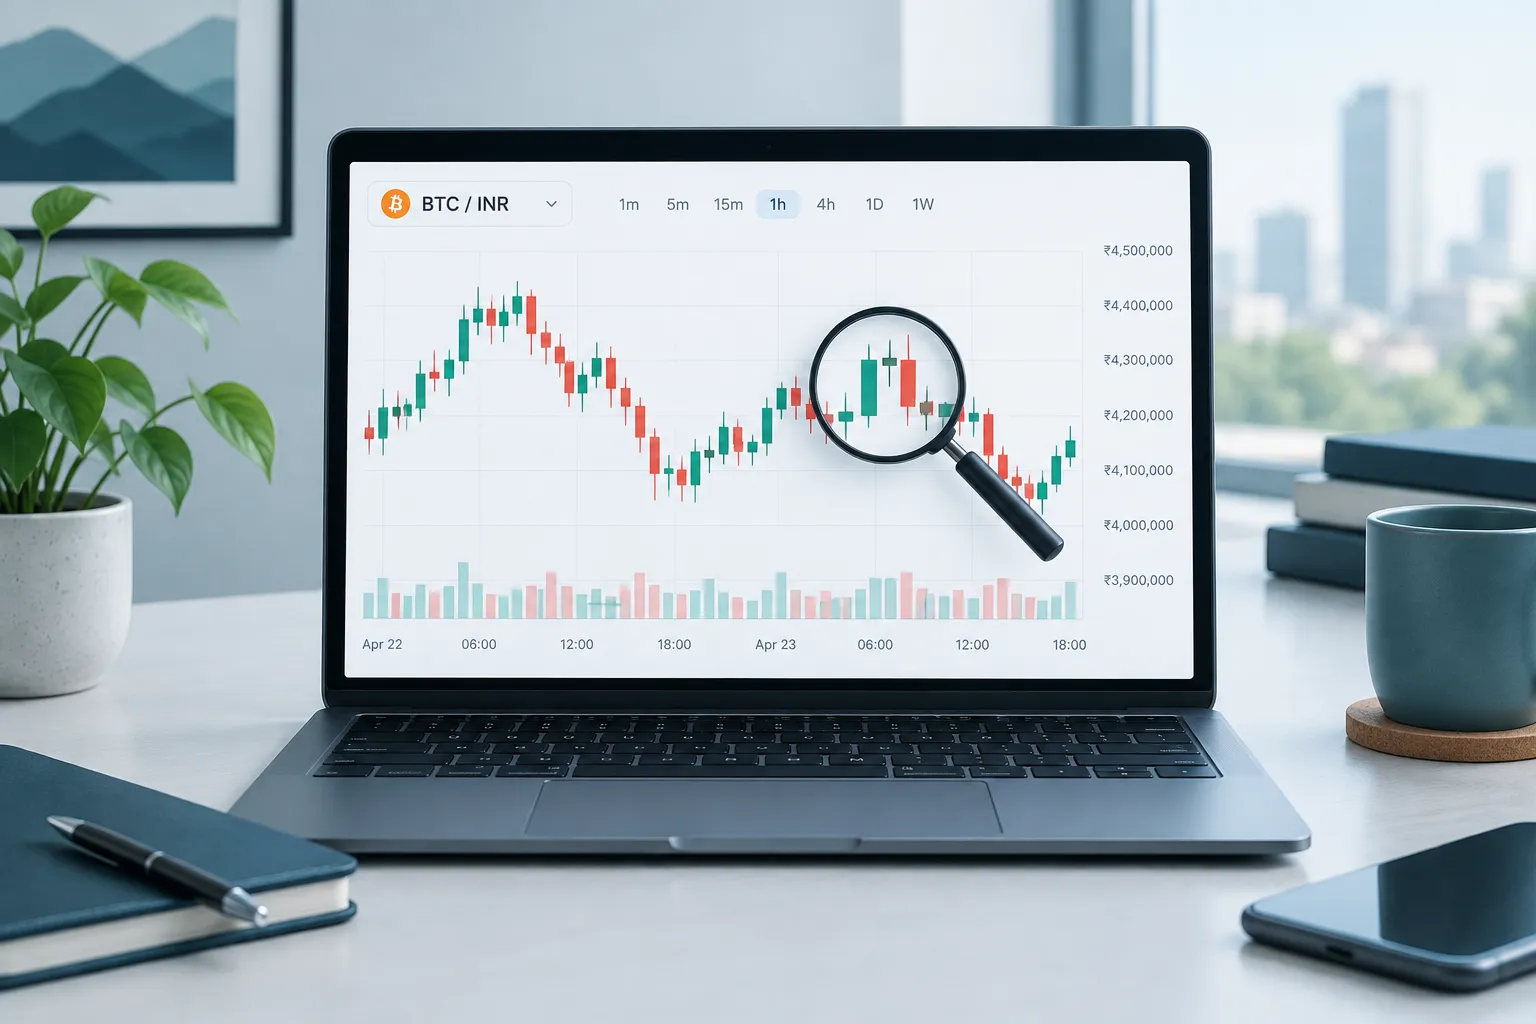
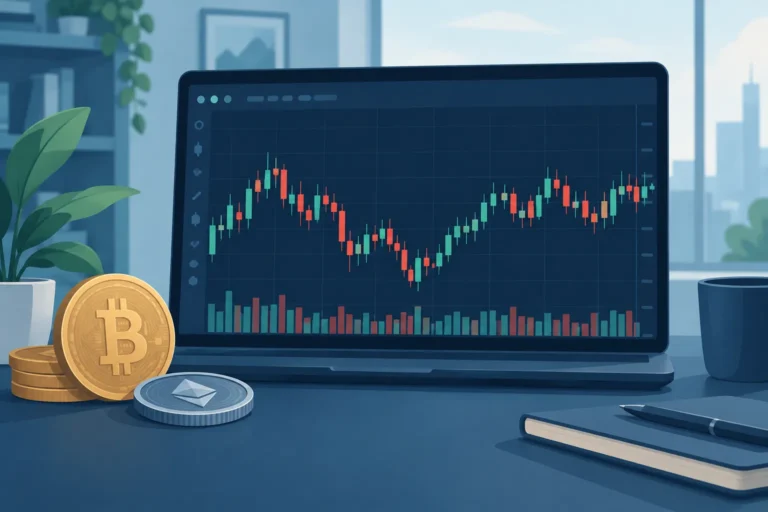
To learn how to read crypto charts, first identify the trading pair, current price, price and time axes, chart timeframe, and data source. Then study how the price moved during each period. On a candlestick chart, every candle shows the open, high, low, and close. Green candles usually indicate a price rise, while red candles usually indicate a fall. Charts describe past and current market activity, but they cannot reliably predict future prices or guarantee profits.
Introduction
A crypto price chart is a visual record of how the price of a cryptocurrency has changed over time. Traders use charts to organise market information, compare price movements, and make more structured decisions.
For example, suppose you are considering buying Bitcoin with Indian rupees. Instead of looking only at the latest BTC price, you may open a BTC/INR chart to see whether the price has been rising, falling, or moving within a range. You can also check how quickly the price has changed and whether trading activity appears orderly or unusually volatile.
Learning how to read crypto charts does not mean learning how to predict every move. A chart contains historical prices and, in a live market, current price information. It cannot tell you with certainty what will happen next. Even a familiar chart pattern can fail because prices are affected by news, regulation, market sentiment, large orders, liquidity, and many other factors.
Charts are therefore best treated as decision-making tools rather than profit-making formulas. They can help you understand risk and plan a trade, but they cannot remove risk.
Understanding Crypto Price Charts and Candlesticks
What a Crypto Price Chart Shows
Before analysing shapes or patterns, read the basic information displayed around the chart. A typical crypto chart includes the following elements:
- Selected asset: This is the cryptocurrency you are viewing, such as Bitcoin, Ether, or Solana.
- Trading pair: This shows the two assets being exchanged, such as BTC/INR, BTC/USDT, or ETH/BTC.
- Latest price: This is the most recent traded price reported by the exchange or chart provider.
- Price axis: Usually displayed vertically, this axis shows the price levels reached by the asset.
- Time axis: Usually displayed horizontally, this axis shows when each price movement occurred.
- Timeframe or interval: This determines how much trading activity each candle or bar represents.
- Data source: This identifies the exchange or service supplying the prices.
The trading pair is especially important. On a BTC/INR chart, the chart shows the value of one Bitcoin in Indian rupees. On a BTC/USDT chart, it shows the value of Bitcoin in USDT. These charts may look similar, but their prices and short-term movements may not be identical.
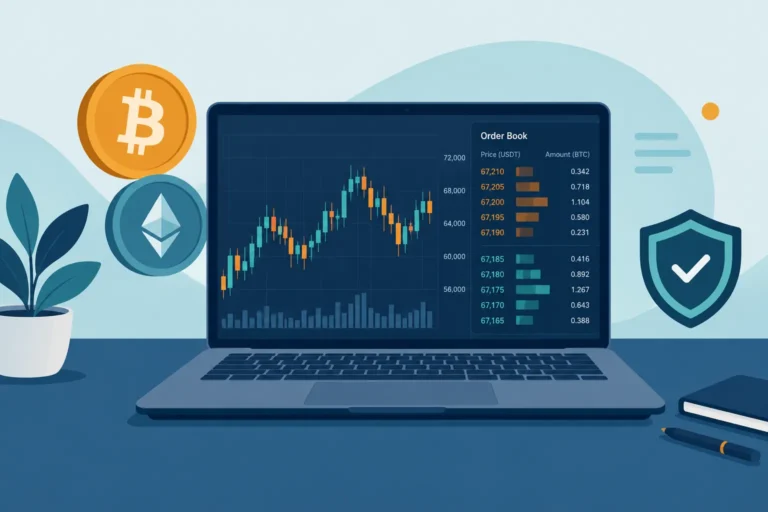
Always check the exchange or data source before drawing conclusions. Crypto does not have one single central exchange that sets a universal price. Buyers and sellers trade on separate platforms, so the quoted price can vary slightly across exchanges. Differences can become larger when a platform has low liquidity or experiences unusual demand, technical problems, or restricted deposits and withdrawals.
Why the Same Crypto Can Look Different Across Charts
Crypto markets can be highly volatile. Prices may move sharply within minutes, particularly after major news or during periods of fear and excitement. A daily chart may make these movements look small, while a five-minute chart may make them appear dramatic.
Liquidity also affects what you see. Liquidity refers, in simple terms, to how easily an asset can be bought or sold without causing a large price change. A popular trading pair on a large exchange may have many active orders. A less popular coin or pair may have fewer buyers and sellers, leading to sudden jumps, long candle wicks, and wider differences between expected and executed prices.
Some movement can be specific to one exchange. For instance, a large order placed on an exchange with limited liquidity may briefly push its price above or below prices on other platforms. Looking at more than one reliable source can help you identify whether a move affected the wider market or only one venue.
Possible market manipulation is another risk, especially in thinly traded tokens. Coordinated buying, misleading promotions, fake-looking activity, or large holders placing sizeable orders can distort the chart. A sharp rise on its own is not proof of genuine demand, and a familiar pattern is not evidence that a trade is safe.
Line, Bar, and Candlestick Charts
Most charting platforms offer several display types. Beginners commonly encounter line, bar, and candlestick charts.
| Chart type | What it shows | When it may be useful |
|---|---|---|
| Line chart | A line connecting selected prices, commonly closing prices | Getting a simple view of the overall direction without much detail |
| Bar chart | Open, high, low, and close for each interval | Reviewing full price ranges in a compact format |
| Candlestick chart | Open, high, low, and close using coloured bodies and wicks | Seeing price direction and the range of movement more clearly |
A line chart is the easiest to read, but it hides much of what happened within each period. Bar and candlestick charts provide more information. Candlesticks are widely used because their colour and shape make price behaviour easier to scan.
How to Read a Candlestick
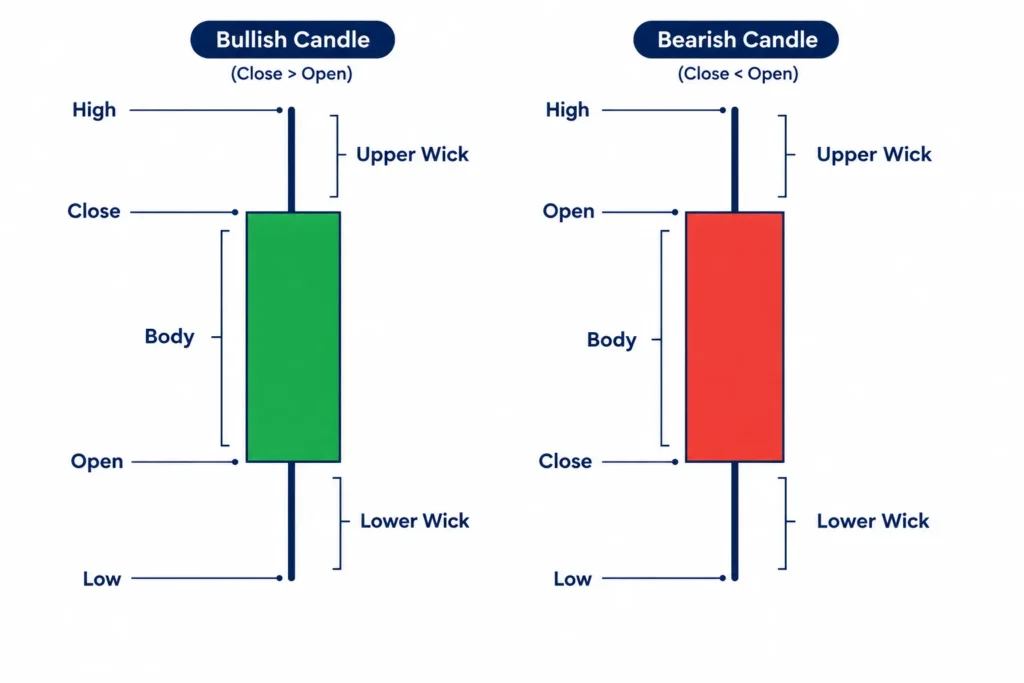
Each candlestick represents price activity during one chosen interval. If the chart uses a one-hour interval, every candle represents one hour. If it uses a daily interval, every candle represents one trading day.
A candle contains four main prices, often shortened to OHLC:
- Open: The price at the beginning of the interval.
- High: The highest traded price during the interval.
- Low: The lowest traded price during the interval.
- Close: The price at the end of the interval.
The thick part is called the body. It covers the distance between the opening and closing prices. Thin lines extending above or below the body are called wicks or shadows.
The upper wick reaches the candle’s highest price. The lower wick reaches its lowest price. Long wicks can show that the price moved far from the body before returning, although they do not explain why that happened.
A bullish candle forms when the closing price is higher than the opening price. Many platforms display it in green. A bearish candle forms when the closing price is lower than the opening price and is commonly shown in red.
Chart colours can be customised, so do not rely on colour alone. Confirm the platform’s settings and check the positions of the open and close. On a bullish candle, the close is at the top of the body and the open is at the bottom. On a bearish candle, the open is at the top and the close is at the bottom.
Imagine that an hourly BTC/INR candle opens at ₹50,00,000, rises to ₹50,40,000, falls to ₹49,80,000, and closes at ₹50,20,000. Its open is ₹50,00,000, high is ₹50,40,000, low is ₹49,80,000, and close is ₹50,20,000. Because the close is above the open, it is a bullish candle. The candle does not mean that Bitcoin will continue rising in the next hour.
Choosing a Chart Interval
Common intervals include one minute, five minutes, 15 minutes, one hour, four hours, one day, and one week. The interval changes what each candle represents, not the underlying asset.
Short intervals contain more market noise and can change quickly. Longer intervals compress more activity into each candle and may make the broader direction easier to see. A practical beginner habit is to start with a longer interval, such as the daily chart, and then move to shorter intervals only if needed.
Candlestick patterns are combinations of one or more candles that traders use to interpret market behaviour. However, names and shapes should not be studied in isolation. The wider trend, trading volume, liquidity, timeframe, and nearby price levels all matter. For broader context, readers can continue with Crypto Trading & Technical Analysis: A Practical Guide, Crypto Trading for Beginners: How to Understand the Basics, and What Are Crypto Candlestick Charts? A Beginner’s Guide.
Reading Trends, Price Areas, Volume and Indicators
Once you understand candles and chart axes, the next step in learning how to read crypto charts is to look at the wider picture. A single candle tells you what happened during one period. A series of candles can show a trend, an important price area or a change in market activity.
These chart signals are not predictions. They help you organise price information and compare possible outcomes. Crypto prices can change suddenly, so every chart reading should leave room for uncertainty.
How to Identify a Market Trend
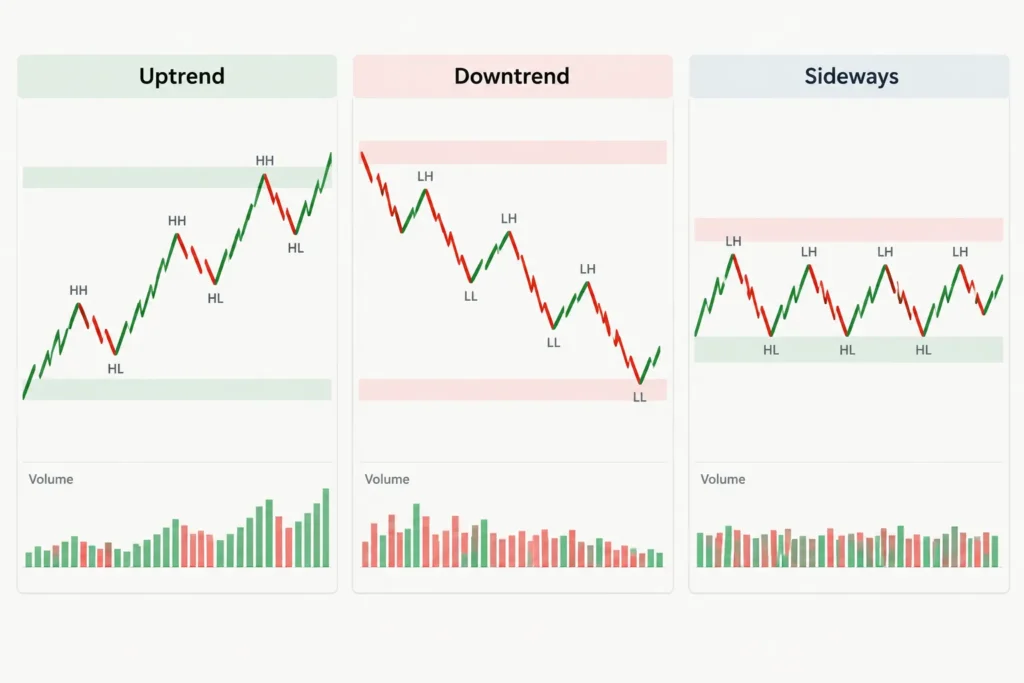
A trend describes the general direction in which price is moving. Markets usually fall into three broad conditions: an uptrend, a downtrend or a sideways market.
To identify a trend, traders often study swing highs and swing lows. A swing high is a local peak where price rises and then turns lower. A swing low is a local bottom where price falls and then turns higher.
- Uptrend: Price generally forms higher highs and higher lows. Buyers are willing to purchase at progressively higher prices.
- Downtrend: Price generally forms lower highs and lower lows. Sellers are accepting progressively lower prices.
- Sideways market: Price moves within a broad range without maintaining a clear upward or downward direction.
Suppose a crypto asset rises from ₹100 to ₹120, falls to ₹110, and then rises to ₹135. The move to ₹135 creates a higher high, while the pullback to ₹110 remains above the earlier ₹100 level. This pattern may indicate an uptrend.
Now imagine that price falls from ₹135 to ₹115, recovers only to ₹125, and then drops to ₹105. The recovery stops at a lower high, and the next decline creates a lower low. This may suggest that a downtrend is developing.
Real charts are rarely this neat. Price may briefly move above an earlier high and then reverse. Different traders may also choose different swing points. Trend identification is therefore partly subjective.
A trend can weaken or reverse at any time. In an uptrend, failure to make a new high may show that buying pressure is slowing. A fall below a previous swing low may provide further evidence of weakness. However, neither event guarantees a complete reversal.
Support and Resistance Are Areas, Not Exact Lines
Support and resistance help traders mark price areas where buying or selling pressure appeared in the past.
Support is an area where falling prices previously attracted buyers or where sellers became less aggressive. Resistance is an area where rising prices previously attracted sellers or where buyers became less willing to pay higher prices.
For example, if a coin repeatedly falls towards ₹500 and then rebounds, traders may treat the region around ₹500 as support. If rallies repeatedly struggle near ₹650, that region may be viewed as resistance.
It is usually better to draw these as zones rather than precise lines. One reversal might happen at ₹498, another at ₹505 and a third at ₹492. Together, these reactions may define a support area around ₹500.
Support is not a guaranteed floor, and resistance is not a guaranteed ceiling. Price can break through either area. A short move beyond a level can also reverse quickly, which traders sometimes call a false breakout.
After a convincing breakout, an old resistance area may sometimes act as support. Similarly, broken support may later act as resistance. This behaviour is common enough to watch, but it does not occur every time.
When marking these areas, look for repeated reactions, visible swing points and places where price changed direction sharply. For a more focused explanation, refer to Crypto Support and Resistance Levels Explained.
What Trading Volume Adds to a Price Chart
Trading volume shows how much of an asset was traded during a selected period. On many charts, volume appears as vertical bars below the price candles. Each bar corresponds to the same period as the candle above it.
Volume adds context to a price move. A sharp rise accompanied by unusually high volume suggests that many market participants were active. The same rise on low volume may reflect less participation and may deserve more caution.
Traders commonly compare price and volume in situations such as these:
- Price breakout with rising volume: The move may have broader participation, although it can still fail.
- Price breakout with weak volume: The move may have limited participation and may be more vulnerable to reversal.
- Large decline with high volume: Selling activity is strong, but the chart alone cannot show whether selling will continue.
- Sideways price with falling volume: Market interest may be reducing while participants wait for new information.
Crypto volume requires extra care because trading takes place across many exchanges. A chart on one exchange may show only the trades completed on that platform. Another website may combine data from several exchanges.
Reported figures can differ because exchanges have different users, trading pairs, liquidity and methods of presenting data. A BTC/INR market on an Indian platform will not necessarily show the same activity as a BTC/USDT market on a global exchange. Always check which market and exchange the chart represents.
Short and Long Timeframes Can Tell Different Stories
A timeframe determines how much time each candle covers. On a five-minute chart, every candle represents five minutes of trading. On a daily chart, each candle represents one day.
Short timeframes provide more detail. They may help an active trader study intraday price movements, but they also contain more noise. Small orders, sudden liquidations or temporary changes in liquidity can create moves that have little importance on a wider chart.
Long timeframes show less detail but make the broader structure easier to see. A daily or weekly chart may reveal a major trend that is difficult to recognise on a five-minute chart.
The same asset can therefore appear bullish on one timeframe and bearish on another. A coin may be rising for the last two hours while remaining in a months-long downtrend. Neither observation is automatically wrong; they describe different periods.
A practical approach is to begin with a longer timeframe to understand the broader direction, then move to a shorter timeframe for additional detail. The useful combination depends on whether you are studying an intraday trade, a swing trade or a longer-term investment.
Moving Averages, RSI and MACD
Indicators are calculations based on price, volume or both. They summarise information already present on the chart. They do not know future prices and should not be treated as automatic buy or sell instructions.
A moving average shows the average price over a chosen number of periods. It smooths short-term fluctuations and can make the general direction easier to see. A short-period moving average responds faster to new prices, while a long-period average changes more slowly.
Traders may watch whether price is above or below a moving average, or whether a shorter average crosses a longer one. These signals can arrive late because moving averages use past prices. They may also produce frequent misleading signals in a sideways market.
The Relative Strength Index, or RSI, measures the speed and size of recent price changes. It moves within a fixed range and is often used to assess whether momentum has become unusually strong or weak.
An “overbought” RSI reading does not mean price must immediately fall. Strong assets can remain overbought while continuing to rise. Likewise, an “oversold” reading does not guarantee a rebound.
The Moving Average Convergence Divergence, or MACD, compares moving averages to show changes in momentum and trend direction. Traders often study its lines, crossovers and histogram. Like other trend-based tools, MACD can lag behind fast price movements and can be less useful in choppy conditions.
No indicator is conclusive. Using several indicators that are based on similar price data does not necessarily provide independent confirmation. Detailed settings and trading rules are better studied separately in dedicated indicator and trading-volume guides.
Use Technical Analysis With Risk Awareness
Technical analysis is one way to study a crypto market. It focuses mainly on price behaviour, volume and repeated chart patterns. It does not fully account for regulation, technology problems, token supply changes, exchange failures, market manipulation or unexpected news.
When learning how to read crypto charts, treat trends, support, resistance, volume and indicators as evidence rather than certainty. Compare multiple timeframes, confirm which exchange and trading pair you are viewing, and consider non-chart information before making a decision.
Most importantly, technical analysis cannot remove investment risk. A well-planned chart setup can still fail, and crypto losses can occur quickly. Avoid assuming that any level, pattern or indicator guarantees a profitable result.
Section 3: Practical Example, Mistakes, Checklist, FAQ and Disclaimer
Now that you know the basic chart elements, it is time to put them together. The example below shows a simple process for reading a crypto chart without treating it as a prediction.
A Hypothetical Crypto Chart Example
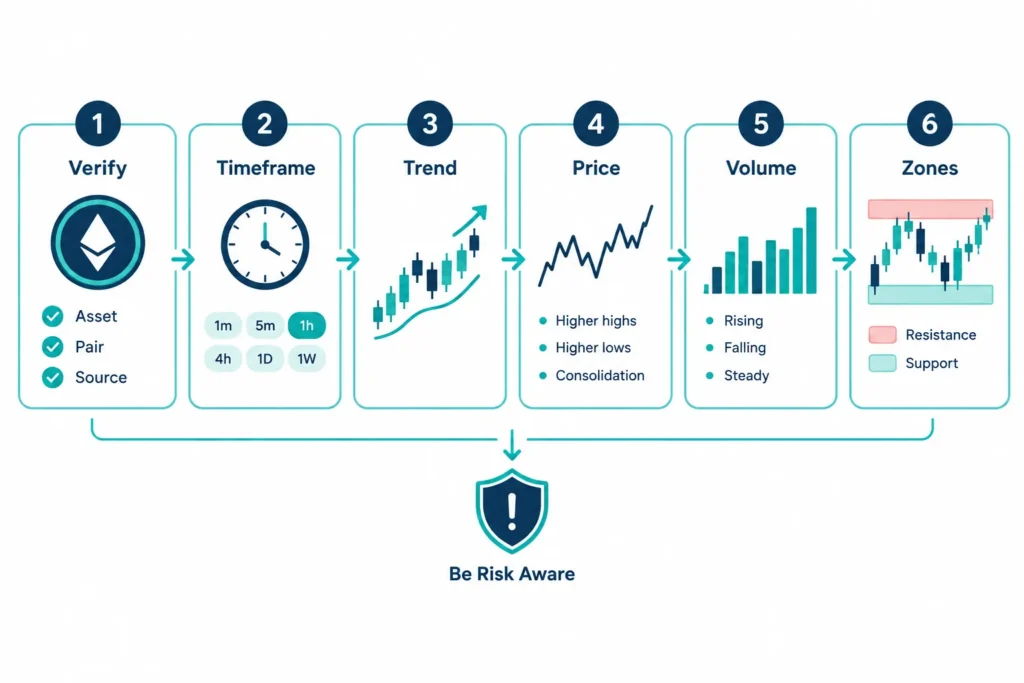
This example uses invented, round-number prices for learning purposes. It is not based on current market data and is not a buy-or-sell recommendation.
Suppose you open a chart labelled ABC/INR. ABC is an imaginary cryptocurrency, while INR is the quote currency. If the displayed price is ₹100, it means one ABC token is valued at ₹100 on that particular trading platform.
Step 1: Confirm the Asset, Pair and Source
First, check that you are looking at the intended asset. Crypto tokens can have similar names or symbols, so do not rely only on the displayed logo.
Next, confirm the trading pair. An ABC/INR chart may look different from an ABC/USDT chart because the quote currencies and trading activity differ. Also note the exchange or data source. Prices can vary slightly across platforms because each exchange has its own buyers, sellers, liquidity and order book.
For this example, assume you have confirmed the following:
- The asset is the imaginary ABC token.
- The trading pair is ABC/INR.
- The chart comes from the exchange you intend to study.
- The price scale is shown in Indian rupees.
Step 2: Select a Timeframe
Assume you choose a four-hour candlestick chart. Each candle now represents four hours of price activity, including the opening, high, low and closing prices during that period.
This timeframe may provide more context than a one-minute chart, which can contain a large amount of short-term noise. However, it does not automatically make the analysis correct. A daily chart may show a broader trend, while a four-hour chart provides a closer view of recent movement.
A useful habit is to begin with a broader timeframe and then move to a more detailed one. For example, you could observe the daily chart before studying the four-hour chart. Avoid moving between timeframes only to find one that supports your preferred opinion.
Step 3: Observe the Possible Trend
Suppose ABC rose from around ₹80 to ₹100, pulled back to ₹92, and then climbed to ₹110. This sequence may show higher highs and higher lows, which can suggest an upward trend over the selected period.
The word “suggest” is important. A trend describes what price has already done. It does not guarantee that the same direction will continue.
You should also check the broader chart. The four-hour chart might appear positive even while the daily chart shows that ABC previously fell from ₹180 to ₹80. In that situation, the recent rise could be a short-term recovery within a larger downtrend.
Step 4: Describe the Price Move Clearly
Instead of immediately calling the chart bullish or bearish, describe what you can see in neutral language.
For example: “ABC moved from approximately ₹80 to ₹110, with a pullback near ₹92. Recent candles closed above the earlier ₹100 area, but the price has not established a long history above that level.”
This approach separates observation from interpretation. It can reduce emotional decisions and make it easier to review your analysis later.
Step 5: Review Volume
Suppose trading volume increased as ABC moved above ₹100. This tells you that more units were traded during that move compared with some earlier periods.
Higher volume may make a price move more noteworthy, but it is not proof that the price will keep rising. Volume does not tell you the full intentions of market participants. It can increase during buying, selling, panic, profit-taking or liquidations.
If price rises while volume steadily falls, you may note that participation appears weaker. Even then, volume should be treated as supporting information rather than a certain trading signal.
Step 6: Mark Possible Support and Resistance Areas
In this imaginary chart, the area around ₹90 to ₹92 may be marked as possible support because price previously pulled back there and then recovered. The ₹110 to ₹112 area may act as possible resistance if the price reaches that zone and repeatedly struggles to move higher.
Support and resistance are better treated as areas rather than exact numbers. Traders may place orders at different prices, and temporary moves beyond a level are common.
If ABC falls below ₹90, support has not broken merely because of one brief trade at ₹89. Some chart readers wait to see whether candles close below the area, whether selling volume changes, and whether price can recover. These observations still do not provide certainty.
Common Mistakes When Reading Crypto Charts
- Relying on one indicator: An RSI, moving average or other indicator should not be treated as a complete decision-making system. Indicators are calculated from past market data and can give false or late signals.
- Confusing correlation with causation: Two events happening together does not prove that one caused the other. A token may rise after a news event, but broader market activity or liquidity may also have influenced the move.
- Ignoring the broader trend: A short-term rise can occur inside a longer downtrend. Check a wider timeframe before interpreting a small move.
- Switching timeframes to support a preferred conclusion: It is easy to keep changing charts until one appears to confirm what you already want to believe. Choose timeframes based on your purpose, not your desired answer.
- Overreacting to short-term moves: Crypto prices can move sharply within minutes. One large candle does not always represent a lasting trend.
- Treating patterns as certain predictions: Triangles, breakouts and other patterns may fail. They show possible market behaviour, not guaranteed outcomes.
Beginner Checklist for Reading a Crypto Chart
Use this checklist before forming a view or considering any trade:
- Asset and source: Have I confirmed the token, trading pair, exchange and price currency?
- Timeframe: Do I know what period each candle represents, and have I checked a broader timeframe?
- Overall trend: Is price generally making higher highs and higher lows, lower highs and lower lows, or moving sideways?
- Volume: Is trading activity increasing or decreasing, and am I avoiding treating volume as proof?
- Price areas: Where are the relevant support and resistance zones? Have I marked areas rather than assuming exact levels?
- Indicator limitations: Am I using indicators as supporting tools rather than guaranteed signals?
- Personal risk: Can I afford a loss? Have I considered my position size, exit plan and the possibility of a sudden move?
A checklist cannot remove market risk. Its purpose is to create a consistent process and reduce avoidable errors.
Frequently Asked Questions
Do crypto charts predict future prices?
No. Charts organise historical and current market data so that you can study price behaviour, volume and possible trends. They can help you develop scenarios, but they cannot guarantee what happens next.
Which chart type can a beginner use?
A line chart is simple and useful for viewing the broad direction of closing prices. A candlestick chart provides more information, including the open, high, low and close. Beginners can start with a line chart and gradually learn candlesticks.
Which timeframe is best for reading crypto charts?
There is no single best timeframe. The suitable choice depends on your purpose. Very short timeframes contain more noise, while daily or weekly charts show broader movement. Beginners can check a wider timeframe first and then use a shorter one for detail.
Why do crypto charts differ across exchanges?
Each exchange has its own users, orders, liquidity and trading volume. As a result, prices, candle shapes and temporary highs or lows may differ. Trading pairs can also produce different charts, especially when they use INR, USDT or another quote currency.
Can a support level fail?
Yes. Support is an area where buying previously appeared or selling slowed, but there is no guarantee that buyers will return. Negative news, broader market weakness, low liquidity or strong selling can push price through support.
Summary
Learning how to read crypto charts involves more than recognising candles or indicators. Confirm the asset, pair and source, choose a suitable timeframe, examine the broader trend, describe price action clearly, review volume carefully, and mark possible support and resistance areas.
A chart is a decision-support tool, not a promise. Avoid relying on one indicator, changing timeframes to justify an opinion, or assuming that a familiar pattern must repeat. A consistent checklist can help you analyse charts more carefully while keeping risk in view.
Educational Disclaimer
This content is for general education only and is not financial, investment, legal or tax advice. The example prices and asset are hypothetical. Cryptocurrency trading is highly volatile and risky, and losses are possible. Chart analysis, indicators, support, resistance and historical patterns do not guarantee future outcomes. Consider your financial situation, conduct independent research and seek qualified professional advice where appropriate before making financial decisions.

Comments