


Quick answer: To understand how to compare mutual funds, first compare schemes with similar objectives, categories and benchmarks. Then review returns across suitable periods, not just the latest one-year figure. Use CAGR for multi-year growth and rolling returns to check how consistently a fund performed across different starting dates. Past performance can support your research, but it cannot guarantee future returns.
Introduction
A mutual fund showing the highest recent return can easily attract attention. However, the highest past return does not automatically make it the best fund for you.
A small-cap equity fund may outperform a large-cap fund during a strong market rally, but it can also experience sharper falls. A debt fund may offer lower returns than both, yet it may be designed for greater stability or a shorter investment period. Comparing these three funds only by return would ignore why they exist and how much risk they take.
A sensible comparison starts with three questions:
- Do the funds have similar investment objectives?
- Do they belong to the same or a closely similar category?
- Are you examining returns over a period that suits the fund type and your financial goal?
This is an important part of the broader process explained in Mutual Funds and SIP Investing in India: A Complete Beginner’s Guide. Returns matter, but they need context. Scheme objectives, categories, benchmarks and time periods help provide that context.
Also remember that mutual fund returns are market-linked. Past performance does not guarantee that a scheme will deliver similar results in the future.
Start with the Right Comparison and Understand Returns
Compare Like with Like
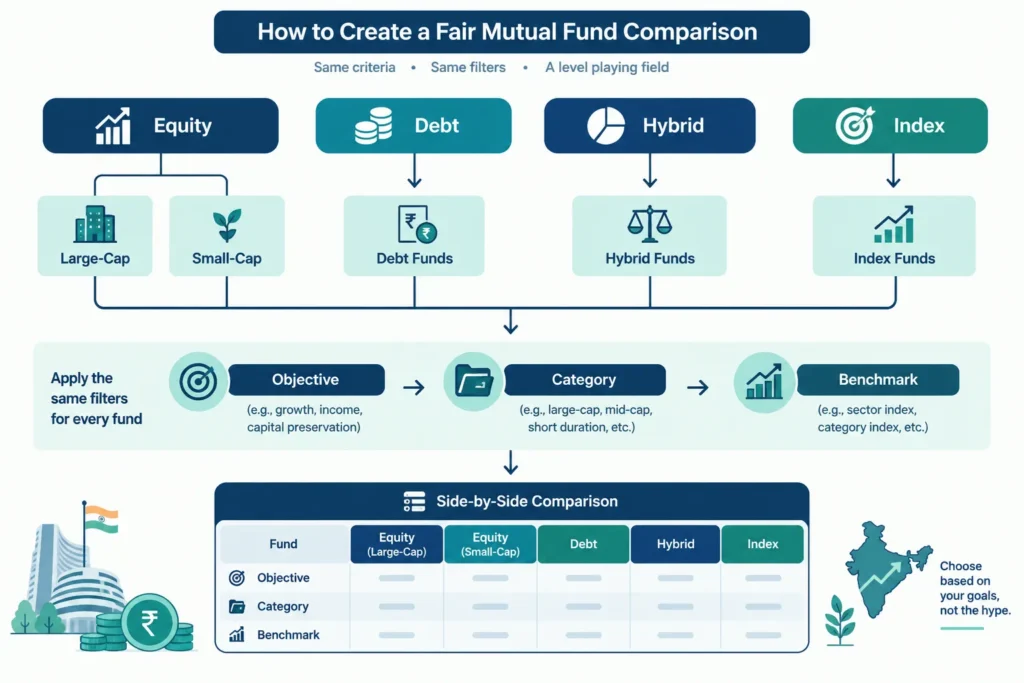
The first rule of mutual fund comparison is simple: compare funds that are trying to do broadly the same job.
Equity, debt, hybrid and index funds have different purposes and risk characteristics:
- Equity funds invest mainly in shares. They usually suit long-term goals and can experience significant short-term fluctuations.
- Debt funds invest mainly in fixed-income securities. Their risks and expected return patterns differ from those of equity funds.
- Hybrid funds combine equity and debt, but the allocation can vary greatly between categories.
- Index funds aim to track a chosen index rather than actively select securities to outperform it.
Even funds within these broad groups may not be directly comparable. A large-cap fund mainly invests in larger listed companies, while a small-cap fund takes exposure to much smaller businesses. The small-cap fund may have higher growth potential, but it generally comes with greater volatility and the possibility of deeper declines.
Suppose an investor is choosing a fund for a long-term goal. One large-cap fund delivered 12% during a particular period, while a small-cap fund delivered 18%. It would be incorrect to conclude that the small-cap fund was automatically better. The two funds operated in different categories and accepted different levels of risk.
A more meaningful comparison would be:
- one large-cap fund with other large-cap funds;
- one small-cap fund with other small-cap funds;
- one corporate bond fund with similar corporate bond funds; or
- one Nifty 50 index fund with other funds tracking the same index.
Closely related categories may sometimes be reviewed together for understanding, but you should clearly account for differences in portfolio rules and risk. For example, a large-cap fund and a large-and-mid-cap fund are both equity funds, yet the second category has meaningful exposure to mid-sized companies. Their returns should not be judged as if their mandates were identical.
Read the Scheme Objective Before Looking at the Return
Every mutual fund scheme has an investment objective. It explains what the scheme aims to achieve and, broadly, how it intends to invest.
One scheme may seek long-term capital appreciation through equities. Another may focus on income generation through debt instruments. An index fund may aim to replicate the performance of a specified index, subject to tracking difference.
The objective helps you decide whether the fund belongs in your comparison at all. It also helps connect the fund to your need. A scheme can perform well against its peers and still be unsuitable if its objective does not match your goal, time horizon or tolerance for fluctuations.
The article How to Choose a Mutual Fund Based on Your Financial Goals explains this goal-first approach in more detail. Fund comparison should come after identifying what you need the investment to do.
Use an Appropriate Benchmark
A benchmark is a reference index used to assess a scheme’s performance. For example, an Indian equity fund may use a broad-market or category-relevant equity index. A debt scheme should use a debt benchmark that reflects a similar maturity and credit profile.
A benchmark comparison can answer a useful question: did the fund perform well relative to the market segment it was supposed to invest in?
However, the benchmark must be appropriate. Comparing a small-cap fund with a large-cap index can create a misleading impression because the underlying companies and risks are different. Similarly, comparing a debt fund’s return with the Nifty 50 says little about how effectively that debt fund was managed.
For an actively managed fund, compare its return with both its benchmark and its category peers over suitable periods. For an index fund, the key return question is usually how closely it followed its chosen index, rather than whether it beat unrelated active funds.
Do Not Judge a Fund Only by Its One-Year Return
Mutual fund factsheets and investment platforms commonly show one-year, three-year, five-year and longer-term returns. Each period tells you something different.
- One-year return: Shows recent performance, but it can be heavily affected by a rally, market fall or temporary sector trend.
- Three-year return: Provides more context, although it may still reflect one particular market phase.
- Five-year return: Is generally more useful for long-term equity comparisons because it may cover a wider range of conditions.
- Longer-term return: Can show how a fund behaved over extended periods, provided the scheme has a sufficiently long and relevant history.
A short period can be misleading. For example, a fund concentrated in one popular sector may rank near the top after that sector rises sharply. If the trend reverses, the ranking may change quickly.
The relevant period should also match the fund type and your intended holding period. For a long-term equity goal, such as retirement many years away, one-year performance should carry limited weight. For a short-duration debt fund intended for a much shorter need, a ten-year equity-style comparison would not be the right framework.
Do not select the period only because it makes a fund look good. Review multiple periods and ask whether the return history is relevant to the scheme’s current category, mandate and investment approach.
Understand Absolute Return and CAGR
Absolute return is the total percentage gain or loss over a period. It does not convert the result into an annual growth rate.
Suppose you invest ₹1,00,000 and its value becomes ₹1,15,000. The absolute return is 15%. If this happened in one year, the one-year return is also 15%. If it happened over three years, 15% is still the total absolute return, but it does not mean you earned 15% every year.
CAGR, or compound annual growth rate, expresses multi-year growth as an annualised rate. It answers this hypothetical question: at what steady annual rate would the starting value have grown to the ending value?
For example, suppose ₹1,00,000 grows to approximately ₹1,21,000 over two years. The CAGR is about 10% a year because ₹1,00,000 growing by 10% in the first year becomes ₹1,10,000, and another 10% growth takes it to approximately ₹1,21,000.
Actual mutual fund returns do not arrive at a smooth rate each year. A fund may rise in one year and fall in another. CAGR simply summarises the overall journey as one annualised number.
CAGR is generally useful when comparing lump-sum investments over periods longer than one year. If you invest through monthly SIPs, every instalment remains invested for a different length of time. The return calculation is therefore different. A SIP Calculator can help estimate the future value of regular contributions, but its assumed return is only an illustration and not a promise.
Use Rolling Returns to Check Consistency
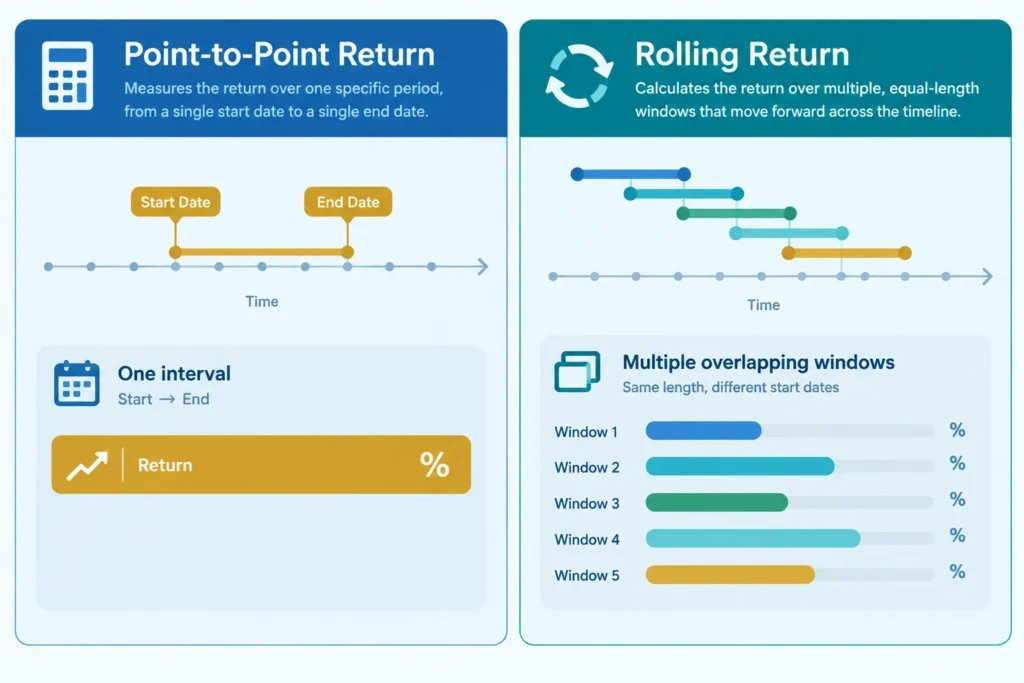
Point-to-point returns use one starting date and one ending date. The result can change considerably if either date moves.
For example, a five-year return calculated from 1 January 2019 to 1 January 2024 describes only that single five-year period. It does not show what happened to investors who started several months earlier or later.
Rolling returns examine many overlapping periods of the same length. A three-year rolling return may be calculated for January 2018 to January 2021, February 2018 to February 2021, March 2018 to March 2021, and so on.
This produces many observations instead of one. You can then see whether a fund performed reasonably across different start dates or whether its attractive result depended mainly on entering at an unusually favourable time.
Imagine two funds have the same five-year CAGR today. Fund A delivered relatively steady results across most three-year rolling periods. Fund B produced excellent returns in a few periods but weak results in many others. The current CAGR alone makes them look similar, while rolling returns reveal a difference in consistency.
Rolling returns still describe the past, so they cannot predict future performance. They are useful because they reduce the dependence on one conveniently chosen date and provide a broader view of historical outcomes.
Return Measures at a Glance
| Return measure | What it means | When it is useful | Main limitation |
|---|---|---|---|
| Absolute return | Total gain or loss between the starting and ending values | Simple comparison over short periods, especially up to one year | Does not show the annualised growth rate for multi-year periods |
| CAGR | Annualised rate that links a starting value to an ending value | Comparing multi-year lump-sum performance | Hides the ups and downs experienced between the two dates |
| Point-to-point return | Return between one specific start date and end date | Understanding performance over a selected period | Can be strongly influenced by the chosen dates |
| Rolling return | Returns for many overlapping periods of equal length | Assessing historical consistency across different starting dates | Requires more data and still cannot predict future returns |
The practical lesson is to avoid treating any single return number as a final verdict. First confirm that the funds have similar objectives and belong to comparable categories. Then use an appropriate benchmark, examine several relevant periods, and use rolling returns to understand whether historical performance was reasonably consistent across different market entry dates.
Section 2: Compare Risk, Costs, Consistency and Fund Quality
Returns are only one part of how to compare mutual funds. Two funds may deliver similar returns but expose investors to very different levels of risk. Their costs, portfolio quality and investment process may also differ.
A useful comparison therefore asks four questions: How much risk did the fund take? What did it cost? How consistently did it follow its strategy? Is the portfolio and fund-management process suitable for your needs?
Read Return and Risk Together
Suppose Fund A and Fund B both delivered a similar five-year return. Fund A moved sharply up and down, while Fund B had smaller fluctuations. The result may look similar, but the investing experience was not.
This does not automatically make Fund B better. Some categories naturally take more risk, and higher volatility may be acceptable to an investor with a long time horizon. The important point is that return should not be judged without understanding the risk taken to earn it.
Several measures can help, but none should be used alone.
Standard Deviation: How Widely Returns Move
Standard deviation indicates how much a fund’s returns have fluctuated around their average. A higher figure generally means the fund has experienced larger swings. A lower figure generally suggests a smoother return pattern.
For example, an equity fund investing in smaller companies may have a higher standard deviation than a large-cap-oriented fund. This is expected because smaller companies can be more volatile.
Standard deviation is most useful when comparing funds in the same category over the same observation period. Comparing the standard deviation of a liquid fund with that of a mid-cap equity fund would not be meaningful because their objectives and underlying assets are very different.
Beta: Sensitivity to the Benchmark
Beta estimates how sensitive a fund has been to movements in its chosen benchmark. A beta near 1 suggests that the fund has broadly moved in line with the benchmark. A beta above 1 indicates greater sensitivity, while a beta below 1 indicates lower sensitivity.
If a fund has a beta of 1.1, it has historically tended to move more than the benchmark in either direction. This is not a prediction. It only describes the relationship observed in the data used.
Beta depends heavily on the benchmark. A comparison becomes misleading if two websites use different benchmarks or if the selected benchmark does not represent the fund’s actual investment universe.
Sharpe Ratio: Return Relative to Volatility
The Sharpe ratio attempts to show how much excess return a fund generated for the volatility it experienced. In general, a higher Sharpe ratio is considered better because it suggests a stronger risk-adjusted result.
However, compare Sharpe ratios only among similar funds and using figures calculated on the same basis. The result can change depending on the time period, return frequency and risk-free rate used in the calculation. A negative Sharpe ratio can also be difficult to interpret and should not be used as a simple ranking tool.
Maximum Drawdown: The Largest Historical Fall
Maximum drawdown measures the largest fall from a previous peak to a later low during a selected period. It gives beginners a practical sense of how painful a bad phase could have been.
For example, if an investment value rose to Rs. 1 lakh and later fell to Rs. 75,000 before recovering, the drawdown from that peak was 25%. An investor who panics during such falls may find it difficult to remain invested, even if the long-term return eventually looks attractive.
Maximum drawdown is historical, not a worst-case limit. A fund can experience a larger fall in the future.
Why Risk Figures May Differ Across Sources
Risk measures shown by an AMC, research platform or financial website may not match exactly. Calculations can differ because of:
- The start and end dates used
- Daily, weekly or monthly return data
- The benchmark selected
- The risk-free rate and calculation method
- Whether direct or regular plan data is used
- How dividends, distributions or missing data are treated
Use the same reliable source and the same period when comparing funds. Treat risk ratios as supporting evidence rather than precise scores that identify a guaranteed winner.
Compare Expense Ratios and Ongoing Costs
The expense ratio is the annual operating cost charged to a mutual fund scheme. It covers expenses such as investment management, administration and other permitted costs. It is deducted from the scheme’s assets, so investors do not usually pay it as a separate bill.
A higher expense ratio reduces the return that reaches the investor, all else being equal. The effect may appear small over one year but can build over long holding periods because the amount deducted no longer remains invested and compounding.
Cost should still be read with context. Choosing a fund only because it has the lowest expense ratio can be a mistake if its category, risk profile or strategy is unsuitable. First compare suitable funds within the same category, and then consider whether the cost is reasonable.
Direct Plans Versus Regular Plans
A direct plan is purchased without a distributor commission being built into the plan’s expenses. A regular plan includes distribution-related costs. Therefore, direct and regular plans of the same scheme generally have different expense ratios and net asset values, even though they usually hold the same underlying portfolio.
A direct plan may suit an investor who can select, monitor and manage funds independently. A regular plan may involve support from a distributor. Investors seeking personalised financial advice should separately understand the adviser’s role, services, fees and regulatory status.
Do not compare the return of one fund’s direct plan with another fund’s regular plan. Use the same plan type for a fair comparison.
Check Exit Loads Before Investing or Redeeming
An exit load is a charge that may apply when units are redeemed or switched out within a specified period. For example, a scheme may impose a load for redemption within one year and no load after that period. The exact rule varies by scheme and may include exemptions or different slabs.
Exit loads matter when money may be needed soon. They can also apply separately to SIP instalments because each instalment has its own allotment date.
Expense ratios and exit-load rules can change. Always check the latest scheme information document, addenda and factsheet rather than relying on an old article or screenshot.
Look for Consistency Across Different Markets
Consistency does not mean that a fund must beat its benchmark every month or every year. Even a well-managed fund can underperform for a period because its investment style is temporarily out of favour.
Review how the fund behaved in rising, falling and sideways markets. Ask whether it participated reasonably in market gains, controlled losses in weak phases and remained aligned with its stated strategy.
Rolling returns can be more informative than a single point-to-point return because they examine many overlapping periods. Calendar-year returns can also reveal whether one exceptional year is making the long-term number look stronger.
Consistent historical outperformance is not a guarantee of future results. It is simply one sign that the result may not depend entirely on a single lucky period.
Review the Fund Manager and Investment Process
Check the fund manager’s experience, but also note how long that person has managed the specific scheme. A ten-year fund track record is less relevant to the current manager if the manager joined only recently.
Manager changes are not automatically negative. Mutual funds may use research teams and documented processes that continue across manager transitions. Still, a recent change means that older performance may reflect a different decision-maker.
Read the stated investment strategy and observe whether the fund follows it. Watch for major style changes, such as a value-oriented fund becoming strongly growth-oriented, or a diversified fund becoming unusually concentrated. Frequent shifts can make the fund harder to understand and may indicate an unstable process.
Examine the Portfolio, Not Just the Fund Name
A fund’s portfolio reveals the risks behind its label. Review:
- Top holdings: A large allocation to a few companies increases concentration risk.
- Sector exposure: Heavy exposure to banking, technology or another sector can strongly influence performance.
- Market-cap mix: Check whether the actual large-cap, mid-cap and small-cap exposure matches the fund’s category and your expectations.
- Diversification: More holdings do not automatically mean better diversification. Fifty companies from closely related industries may be less diversified than a smaller portfolio spread across different businesses.
- Credit quality: For debt funds, examine the credit ratings, issuer concentration and maturity profile. Higher-yielding securities may involve higher credit or interest-rate risk.
- Portfolio turnover: High turnover suggests frequent buying and selling. It may be part of the strategy, but consistently high turnover deserves attention because it can create trading costs and indicate rapid portfolio changes.
Portfolio data is a snapshot and can change. Review several recent factsheets to understand whether an exposure is temporary or part of a continuing pattern.
Do Not Confuse Fund Selection With Payout Choice
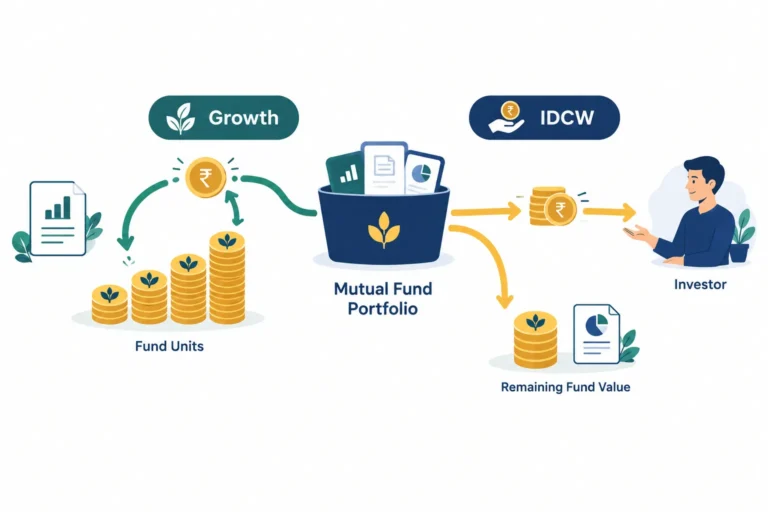
After selecting a scheme, investors may need to choose between Growth and IDCW options. Under Growth, gains remain invested in the scheme. Under IDCW, the scheme may distribute income when declared, but distributions are not assured and the NAV falls to the extent of the payout and applicable adjustments.
The choice does not make the underlying portfolio better or worse. It affects how returns are received and may have tax implications. The Growth vs IDCW Mutual Fund Options article explains this decision in more detail.
Similarly, needing regular cash flow after retirement does not mean an investor should select a fund merely because it appears to provide income. Withdrawal planning is a separate decision involving the amount, frequency, tax impact and ability of the investment to support withdrawals. The SWP article explains how systematic withdrawal plans work and the risks involved.
A sound comparison brings all these factors together. Shortlist funds with a suitable objective first, then compare risk-adjusted performance, costs, consistency, management process and portfolio quality on the same basis.
Section 3: Apply the Framework, Use the Checklist and Answer Common Questions
Once you understand returns, risk and costs, the next step is to bring them together. A mutual fund should not be selected because of one impressive number. It should be compared with funds from the same category, using the same benchmark and similar time periods.
A Hypothetical Comparison of Two Mutual Funds
The following example is purely illustrative. Fund A and Fund B are assumed to be diversified equity funds from the same category. Both are compared with the same suitable benchmark. The figures do not represent any real scheme.
| Comparison point | Fund A | Fund B | Benchmark |
|---|---|---|---|
| 1-year return | 18.0% | 15.5% | 16.0% |
| 3-year annualised return | 14.5% | 13.8% | 13.0% |
| 5-year annualised return | 13.2% | 13.5% | 12.4% |
| Volatility or standard deviation | 17.0% | 14.5% | 16.0% |
| Maximum drawdown | -25.0% | -19.0% | -23.0% |
| Sharpe ratio | 0.72 | 0.84 | Not directly relevant for basic comparison |
| Expense ratio | 1.00% | 0.65% | Not applicable |
| Performance against benchmark | Beat it over 1, 3 and 5 years | Lagged over 1 year; beat it over 3 and 5 years | Reference point |
Fund A has the better 1-year and 3-year returns. Looking only at recent performance might therefore make Fund A appear to be the obvious choice. However, the remaining numbers add important context.
Fund B has a slightly higher 5-year return, lower volatility and a smaller maximum drawdown. In this example, it also has a higher Sharpe ratio. This suggests that Fund B delivered more return for each unit of risk taken during the measured period.
Fund B also has the lower expense ratio. A difference in costs may appear small, but recurring expenses reduce the amount that remains invested. The effect becomes more meaningful over a long holding period. However, cost should be considered alongside portfolio quality, strategy and risk-adjusted performance.
Fund A may suit an investor who accepts greater fluctuations in pursuit of stronger performance. Fund B may appeal to someone who prefers relatively smoother performance and lower costs. Neither fund is automatically suitable for every investor. Both are equity funds, so both can experience substantial losses and may be unsuitable for short-term goals.
Also check whether the difference is persistent. One return figure cannot show consistency. Compare rolling returns over several periods and observe how often each fund beat its benchmark and category peers. A fund that performs reasonably across different market conditions may be more dependable than one that alternates between exceptional gains and severe falls.
Practical Mutual Fund Comparison Checklist
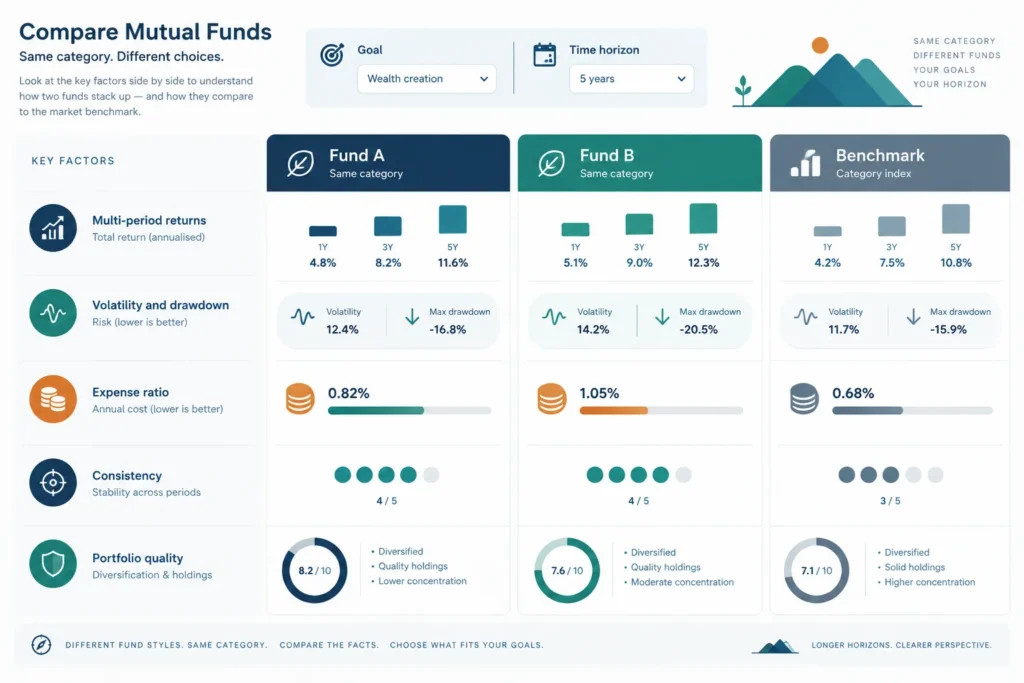
Use this checklist when deciding how to compare mutual funds. Complete the investor-related checks first and the performance checks later.
- Define the goal: Identify what the money is for, such as retirement, a child’s education or a house down payment. A clear goal helps determine the appropriate type of fund.
- Set the time horizon: Estimate when the money will be needed. Equity funds generally require a longer horizon, while short-term goals may need less volatile options.
- Assess risk capacity: Consider your income stability, emergency fund, existing debt and ability to handle losses. Risk capacity is different from simply feeling confident during a rising market.
- Compare the same category: Compare a large-cap fund with other large-cap funds, not with a small-cap or liquid fund. Different categories have different mandates and risk levels.
- Use a suitable benchmark: Check performance against the benchmark stated in the scheme documents. The benchmark should reflect the fund’s investment universe.
- Check multiple return periods: Review 1-year, 3-year, 5-year and longer returns where available. Give more importance to periods that match your intended holding period.
- Study rolling returns: Rolling returns show performance across many overlapping periods. They are useful for judging consistency and reducing dependence on one start and end date.
- Examine downside behaviour: Check volatility, maximum drawdown and performance during market declines. Ask whether you could remain invested through a similar fall.
- Compare risk-adjusted performance: Measures such as the Sharpe ratio can help indicate whether higher returns came from better management or simply from taking more risk.
- Review all costs: Compare expense ratios for the same plan type. Also understand exit load and the tax treatment applicable when you redeem.
- Check the fund manager: Note the manager’s tenure and whether performance was achieved under the current team. A long return history may be less relevant if the manager or process changed recently.
- Understand the strategy: Read how the fund selects investments, allocates across sectors and manages risk. Avoid investing in a strategy you do not understand.
- Inspect major holdings: Look for concentration in a few companies or sectors. If you own other funds, check whether their portfolios overlap significantly.
- Read official documents: Review the Scheme Information Document, Key Information Memorandum, factsheet and relevant addenda. Confirm the investment objective, benchmark, risks, costs and exit rules.
Prefer information published by SEBI, AMFI and the fund house or AMC. Official scheme documents and monthly factsheets are generally better primary sources than advertisements, social media posts or return screenshots.
Frequently Asked Questions
1. How many years of returns should I check?
Check several periods rather than relying on the latest year. For an equity fund, review 3-year, 5-year and longer performance where sufficient history is available. Also examine how the fund behaved in rising, falling and sideways markets. A new fund without a long record should not be assumed to be better or worse solely because its history is limited.
2. Is CAGR or rolling return better for comparison?
Both serve different purposes. CAGR shows the annualised growth between one starting date and one ending date. Rolling returns calculate results across many start and end dates, making them more useful for studying consistency. Use CAGR for a simple summary and rolling returns for a broader assessment.
3. Is the fund with the lowest expense ratio always best?
No. Lower expenses are beneficial when other factors are broadly similar, but the cheapest fund may not have the right strategy, risk profile or consistency. Compare costs within the same category and plan type. Do not use expense ratio as the only selection rule.
4. What does a good Sharpe ratio mean?
A higher Sharpe ratio generally indicates better returns per unit of risk, provided the same calculation method and period are used. It is most useful when comparing similar funds. There is no single number that is “good” in every category or market environment, and a negative Sharpe ratio requires careful interpretation.
5. Are direct plans suitable for everyone?
Direct plans have a lower expense ratio because they do not include distributor commissions. They may suit investors who can select, monitor and manage funds independently. Someone who needs advice, behavioural support or ongoing portfolio guidance may prefer professional help. Compare the quality and cost of that help before deciding.
6. How often should I review my mutual funds?
A review once or twice a year is usually more useful than checking daily. Review sooner if your goal, time horizon or financial situation changes, or if the scheme undergoes a major change in mandate, manager or strategy. Short-term underperformance alone is not always a reason to exit.
7. Are mutual fund star ratings enough?
No. Ratings are typically based on past data and may change when markets or methodologies change. They can be a starting filter, but they do not assess your personal goals or risk capacity. Read the underlying return, risk, cost and portfolio details before investing.
8. Can I compare two funds from different categories?
You may compare their broad role in your portfolio, but a direct performance comparison can be misleading. For example, a small-cap equity fund and a short-duration debt fund have different objectives, risks and benchmarks. First decide which category fits the goal, and then compare funds within that category.
Summary
To understand how to compare mutual funds, begin with your goal, time horizon and ability to take risk. Compare funds from the same category against the same suitable benchmark. Study multiple return periods, rolling returns, downside behaviour, risk-adjusted performance, expenses, strategy, manager history and portfolio holdings.
Do not select a fund only because it has the highest recent return, the lowest cost or the best star rating. Use SEBI and AMFI information along with official AMC scheme documents and factsheets. The final choice should fit your financial plan, not merely lead a performance table.
This article is for education and is not personalised investment advice. Mutual fund investments are subject to market risks. Read all scheme-related documents carefully.



Comments