

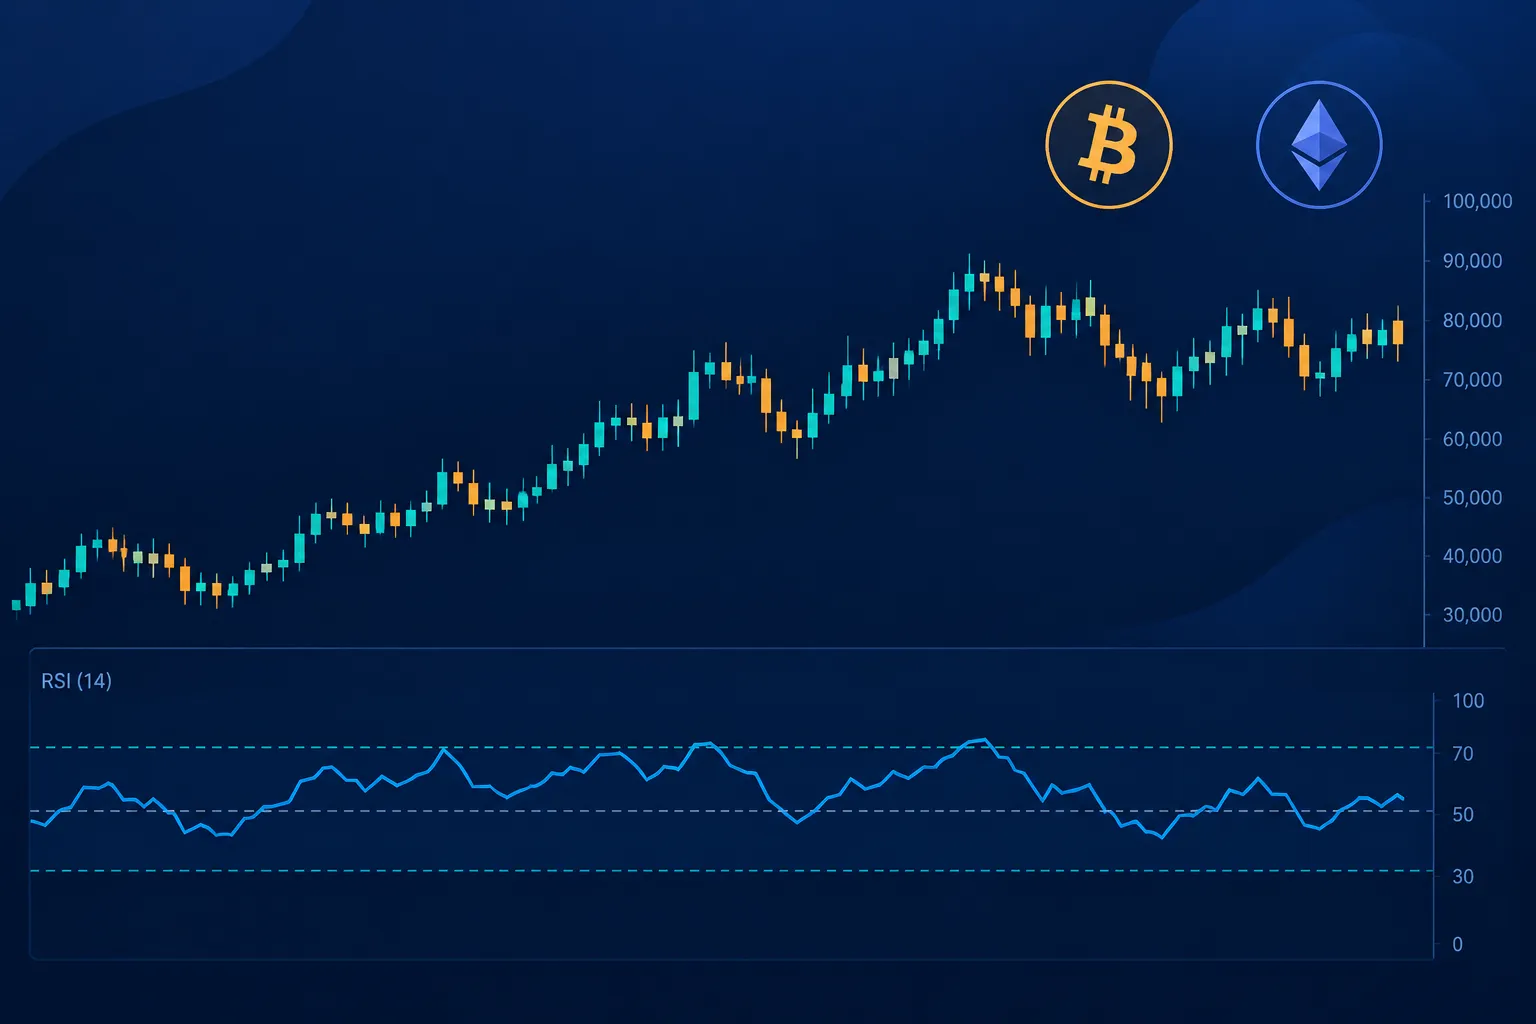
The Relative Strength Index, or RSI, is a momentum indicator that measures the speed and magnitude of recent price movements. The RSI indicator crypto traders see on a chart moves between 0 and 100. A high reading means recent upward moves have been stronger than recent downward moves, while a low reading means the opposite.
Most charting platforms use a 14-period RSI by default. Traders commonly watch the 70, 30 and 50 levels, but these numbers are not automatic buy or sell signals. RSI is based on historical prices, so it is a lagging indicator and should be read alongside price action and the wider market trend.
Introduction
Crypto prices can move quickly. A coin may rise sharply for several candles, pause, and then continue higher. It may also fall suddenly after appearing strong. Looking at price alone does not always make it easy to judge how powerful a move has been.
RSI helps organise this information. It compares recent upward price changes with recent downward price changes and converts the result into a simple number. This gives traders a quick way to assess momentum.
You may find RSI below the main price chart on platforms used to analyse Bitcoin, Ether and other cryptocurrencies. It normally appears as a line moving within a fixed range from 0 to 100.
However, RSI does not predict the future and does not tell you whether a cryptocurrency is fairly valued. It only describes recent price momentum according to its calculation. Understanding that calculation is important before using the indicator in a trading decision.
RSI is one of several tools covered under Crypto Trading & Technical Analysis. Beginners may also find it useful to first understand candles, timeframes, support and resistance through a guide on how to read crypto charts.
Understanding RSI and How It Is Calculated
What Does RSI Mean?
RSI stands for Relative Strength Index. It was developed as a momentum indicator, which means it tries to show the strength of recent price movement rather than the rupee value of an asset.
The word “relative” refers to the comparison between the asset’s own recent gains and losses. It does not usually mean that Bitcoin is being compared with Ether, or that one crypto token is being compared with another.
For example, suppose Bitcoin closes higher in several recent candles and the increases are relatively large. Its RSI will generally rise. If Bitcoin records repeated or large downward changes, its RSI will generally fall.
RSI measures both the speed and magnitude of price movements. Speed relates to how quickly prices are changing over recent periods. Magnitude relates to the size of those changes.
Because the calculation uses prices that have already appeared on the chart, RSI is a lagging indicator. It reacts to completed or developing price movements; it does not know what the next candle will do.
The RSI Formula
The calculation has two main steps:
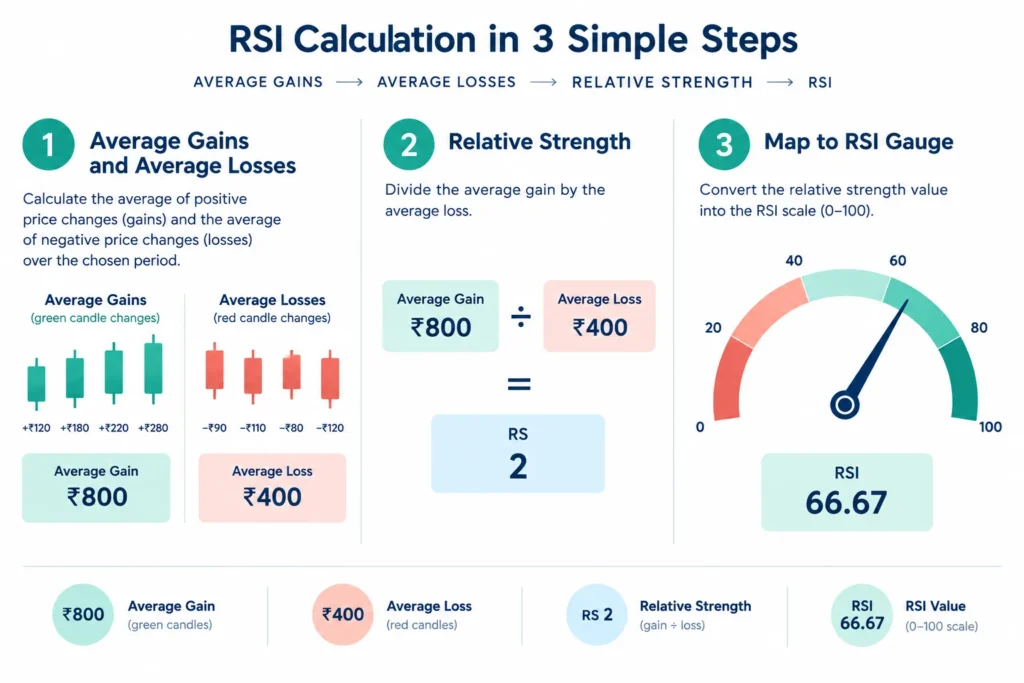
RS = Average Gain ÷ Average Loss
RSI = 100 − [100 ÷ (1 + RS)]
Here, RS means “relative strength”. It compares the average size of upward price changes with the average size of downward price changes over the selected lookback period.
- Average gain: The average of positive price changes during the selected periods. Periods without a gain are counted as zero for this part of the calculation.
- Average loss: The average size of negative price changes during the same periods. Losses are normally used as positive values in the formula, while periods without a loss are counted as zero.
- Relative strength: Average gain divided by average loss. A larger result means gains have been stronger than losses over the measured period.
Charting platforms calculate and plot RSI automatically. Traders usually do not need to work it out manually, but knowing the formula helps explain why the line moves.
A Simple Hypothetical Calculation
Assume a cryptocurrency is trading in rupees and you are reviewing its last 14 daily candles. After accounting for all positive and negative closing-price changes, suppose the calculation produces the following values:
| Calculation item | Hypothetical value |
|---|---|
| Average gain | ₹800 |
| Average loss | ₹400 |
| Relative strength | ₹800 ÷ ₹400 = 2 |
| RSI | 100 − [100 ÷ (1 + 2)] = 66.67 |
The resulting RSI is approximately 66.67. This happens because the recent average gain is twice the recent average loss. If average gains became larger while average losses stayed the same, relative strength and RSI would rise. If losses became larger compared with gains, RSI would fall.
The rupee amounts in this example are only hypothetical price changes. The same calculation can apply when a cryptocurrency is quoted in USDT, dollars or another currency because RSI is based on the relationship between gains and losses, not the currency symbol.
Traditional RSI calculations use a smoothing method after the first set of values. This means the next reading incorporates information from the previous average as well as the latest price change. As a result, the RSI line often moves more smoothly than a calculation based only on a fresh simple average for every candle.
Why RSI Always Stays Between 0 and 100
The RSI formula converts relative strength into a fixed scale ranging from 0 to 100. It cannot normally move above 100 or below 0.
A reading closer to 100 indicates that upward price changes have dominated the measured period. A reading closer to 0 indicates that downward changes have dominated. A reading near the middle suggests a more balanced relationship between recent gains and losses.
This fixed scale makes RSI easier to compare across different cryptocurrencies. Bitcoin and a lower-priced token may have very different market prices, but their RSI readings still appear on the same 0–100 scale.
What Does a 14-Period RSI Mean?
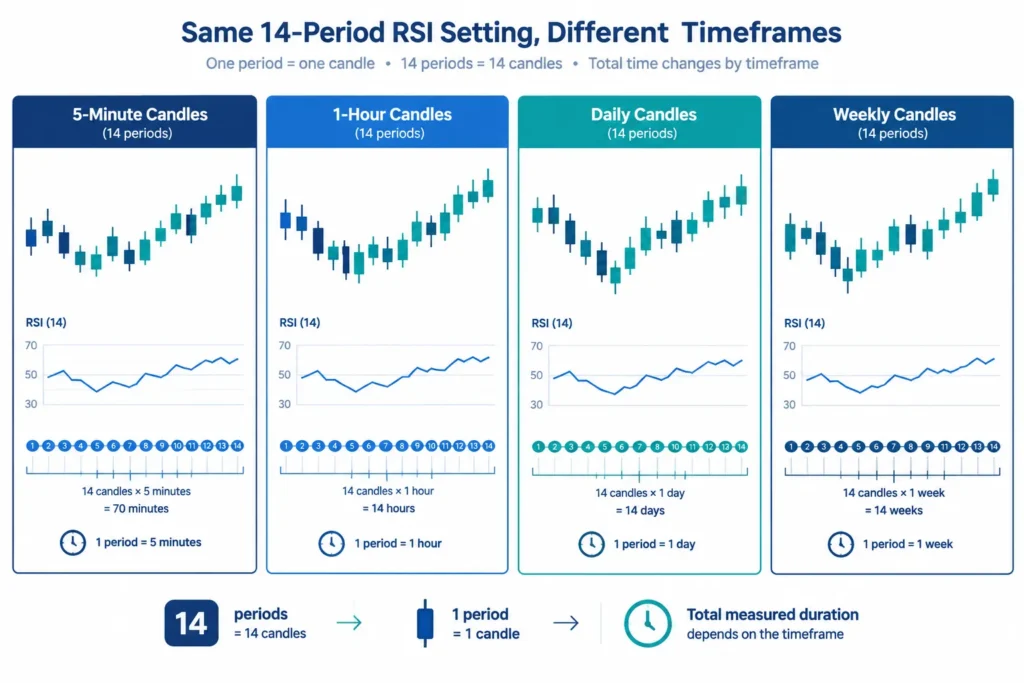
The most commonly used default is a 14-period RSI. A period means one candle, not necessarily one day.
- On a 5-minute chart, 14 periods means 14 five-minute candles.
- On a 1-hour chart, it means 14 hourly candles.
- On a daily chart, it means 14 daily candles.
- On a weekly chart, it means 14 weekly candles.
Therefore, the same 14-period setting can describe very different stretches of market activity. A 14-period RSI on a five-minute Bitcoin chart may change much faster than the same setting on a daily chart.
A shorter lookback usually makes RSI more responsive to recent moves, but it may also produce more frequent swings. A longer lookback generally creates a smoother indicator that reacts more slowly.
No single RSI setting is best for every cryptocurrency, market condition or timeframe. A setting used by a short-term trader may not suit someone studying daily or weekly trends. Less-liquid tokens may also behave differently from heavily traded assets such as Bitcoin and Ether.
Understanding the 70, 30 and 50 Levels
Three reference levels commonly appear on an RSI panel:
- 70: A reading above 70 is often described as overbought. It means upward momentum has been strong, but it does not guarantee that the price will immediately fall.
- 30: A reading below 30 is often described as oversold. It means downward momentum has been strong, but it does not guarantee an immediate recovery.
- 50: This is the midpoint. Readings above 50 generally indicate that recent gains are stronger than recent losses, while readings below 50 indicate the reverse.
These levels are reference points, not standalone trading instructions. During a strong crypto uptrend, RSI can remain above 70 or repeatedly return to that area while the price continues rising. During a strong downtrend, it can remain below 30 while the price continues falling.
For that reason, an RSI reading should be interpreted in the context of the selected timeframe, the direction of the price trend and what the candles are showing. The indicator summarises recent momentum; it does not remove uncertainty or replace risk management.
How Crypto Traders Interpret RSI Signals
The RSI indicator in crypto trading is usually read on a scale from 0 to 100. Traders commonly focus on three reference levels: 70, 30 and 50. These levels help describe momentum, but they do not predict the future with certainty.
An RSI reading above 70 is generally called overbought, while a reading below 30 is called oversold. The 50 level acts as a midpoint that can help traders judge whether buying or selling momentum is stronger.
These readings should be treated as clues, not standalone trading instructions. Crypto prices can move quickly, and strong trends may keep RSI at extreme levels for much longer than a beginner expects.
What Does an RSI Above 70 Mean?
When RSI rises above 70, the crypto asset has experienced strong upward momentum over the indicator’s calculation period. Traders describe this condition as overbought.
Overbought does not necessarily mean that the asset is overpriced. It also does not mean that the price must fall immediately. It simply shows that recent gains have been strong compared with recent losses.
For example, suppose Bitcoin breaks above an important resistance level after positive market news. RSI may move above 70 while the price continues to climb. A trader who sells only because RSI crossed 70 could exit too early and miss part of the trend.
Instead, traders may treat an overbought reading as a reason to become more cautious. They might watch for additional evidence such as:
- Price failing to remain above a resistance level.
- A bearish candlestick pattern near a recent high.
- Trading volume weakening as price rises.
- RSI falling back below 70 after reaching an extreme level.
- A bearish divergence between price and RSI.
Therefore, an RSI above 70 is a momentum warning, not an automatic sell signal.
What Does an RSI Below 30 Mean?
When RSI falls below 30, the crypto asset has experienced strong downward momentum. This condition is generally described as oversold.
Oversold does not automatically mean that the asset is cheap or ready to recover. During a sharp market decline, RSI can remain below 30 while the price continues making new lows.
Consider a smaller crypto token facing negative regulatory news or a security concern. Its RSI may fall below 30, but sellers may remain in control. Buying immediately could expose a trader to further losses.
Traders may instead look for signs that selling pressure is weakening. These could include:
- Price finding support near an established level.
- RSI moving back above 30.
- Improving trading volume during a price recovery.
- A bullish price pattern or strong reversal candle.
- A bullish divergence between price and RSI.
An RSI below 30 should therefore be viewed as a possible warning of stretched selling momentum, not an automatic buy signal.
Why the 50 Level Matters
The 50 level is the midpoint of the RSI scale. It can help traders assess the broad direction of momentum without waiting for RSI to reach 70 or 30.
When RSI stays above 50, average gains are generally stronger than average losses over the selected period. This may support a bullish momentum view. When RSI remains below 50, average losses are generally stronger, which may support a bearish view.
Some traders watch whether RSI uses 50 as support or resistance. In an upward trend, RSI may fall towards 50 during a price pullback and then turn higher. In a downward trend, it may rise towards 50 during a temporary recovery and then fall again.
A single move across 50 is not always meaningful. In a sideways market, RSI can cross the midpoint repeatedly and produce confusing signals. Traders usually interpret it alongside price structure, trend direction and support or resistance.
RSI Behaviour in Bullish and Bearish Markets
RSI does not behave in exactly the same way under all market conditions. Its normal range can shift depending on whether buyers or sellers are in control.
During a strong bullish market, RSI may spend more time above 50 and frequently reach 70 or higher. Pullbacks may cause RSI to fall only towards the 40-to-50 area before momentum returns. In such a market, repeated overbought readings can reflect trend strength rather than an immediate reversal.
During a bearish market, RSI may spend more time below 50 and repeatedly approach or fall below 30. Temporary price recoveries may lift RSI only towards the 50-to-60 area before sellers return. Repeated oversold readings can therefore occur while the broader downtrend remains intact.
These shifting ranges help explain why fixed levels should not be read in isolation. A trader following a crypto trading for beginners guide should first identify the market condition and then interpret RSI within that context.
Momentum Warning Versus Confirmed Reversal
RSI measures momentum. It can warn that a move is becoming stretched or that momentum is changing, but it does not confirm by itself that price has reversed.
For instance, RSI moving below 70 may show that upward momentum has slowed. A confirmed bearish price reversal would normally require stronger price-based evidence, such as a lower high followed by a break below support.
Similarly, RSI moving above 30 may indicate that selling momentum has eased. Confirmation of a bullish reversal could involve price forming a higher low and then breaking above a recent swing high.
This distinction is important in crypto because prices can pause briefly and then resume the original trend. Traders who confuse a momentum warning with a confirmed reversal may enter too early or take positions against a strong trend.
How Bullish RSI Divergence Works
Bullish divergence occurs when price forms a lower low but RSI forms a higher low. It suggests that price is still falling, but downward momentum is weakening.
Imagine Ether declines from ₹2,00,000 to ₹1,85,000 and RSI reaches 25. After a temporary recovery, Ether falls again and records a lower low at ₹1,80,000. However, RSI records a higher low at 32.
Price has weakened because it made a lower low, but RSI has strengthened because it made a higher low. This difference is bullish divergence. It may warn that sellers are losing momentum and that a recovery could develop.
However, bullish divergence is not confirmation that the bottom is in place. Price may move sideways, fall further or create several divergences before recovering. Traders may wait for price to break above resistance or form a clear higher high before treating the reversal as confirmed.
How Bearish RSI Divergence Works
Bearish divergence occurs when price forms a higher high but RSI forms a lower high. It suggests that price is still rising, but upward momentum is weakening.
Suppose Bitcoin rises to ₹50 lakh while RSI reaches 78. After a pullback, Bitcoin climbs to a new high of ₹52 lakh. This time, RSI reaches only 68.
Price has made a higher high, while RSI has made a lower high. This bearish divergence may indicate that buyers are losing momentum and that the rally is becoming vulnerable.
Even so, the price may continue rising before any correction occurs. Bearish divergence can fail in a strong bull market, especially when fresh buying demand keeps entering. Traders often look for confirmation through a support break, a lower price high or another sign that sellers have gained control.
Quick Comparison of Common RSI Signals
| RSI signal | What it may indicate | Important caution |
|---|---|---|
| Above 70 | Strong upward momentum and an overbought condition | It is not an automatic sell signal; RSI can remain overbought in a strong uptrend |
| Below 30 | Strong downward momentum and an oversold condition | It is not an automatic buy signal; RSI can remain oversold in a strong downtrend |
| Above or below 50 | Above 50 may support bullish momentum, while below 50 may support bearish momentum | Frequent crossings can be unreliable in a sideways market |
| Bullish divergence | Price makes a lower low while RSI makes a higher low | The possible recovery may fail or take time to develop |
| Bearish divergence | Price makes a higher high while RSI makes a lower high | The rally may continue despite weakening momentum |
The key is to read RSI as part of the wider market picture. Overbought, oversold, midpoint and divergence signals become more useful when they agree with price structure and the prevailing trend. None of them guarantees a reversal or a profitable trade.
Using RSI With Confirmation, Avoiding Mistakes and FAQs
The RSI indicator in crypto trading is most useful when it is treated as one piece of evidence, not as a complete trading system. An overbought or oversold reading shows momentum conditions. It does not confirm what the price will do next.
Before acting on an RSI signal, traders may check the broader trend, nearby price levels, trading volume and other indicators. This extra context can help filter weak signals, although it cannot remove risk.
Combining RSI With Moving Averages
A moving average helps show the general direction of price. For example, a trader may compare the current price with a 50-period moving average.
- If the price is above a rising moving average, the broader trend may be upward.
- If the price is below a falling moving average, the broader trend may be downward.
- If the moving average is flat and price keeps crossing it, the market may lack a clear trend.
Suppose a cryptocurrency trades at ₹200 and remains above a rising moving average. Its RSI falls close to 30 during a temporary decline and then starts moving higher. A trader may view this differently from an RSI near 30 while price is below a sharply falling moving average.
In the first case, the RSI movement may indicate that a pullback is losing momentum within an uptrend. In the second case, the low RSI may simply reflect strong selling pressure in an ongoing downtrend. Neither situation guarantees a reversal.
Using RSI With Support and Resistance
Support and resistance can provide useful price context. Support is an area where buying interest has appeared before, while resistance is an area where selling interest has previously increased.
Imagine that a coin has repeatedly found support near ₹500. It falls from ₹560 to ₹505, while RSI moves below 30. If price begins to stabilise near ₹500 and forms a strong bullish candle, the combination may be more meaningful than the RSI reading alone.
However, support can break. A trader should not assume that ₹500 will hold simply because RSI is oversold. The crypto support and resistance article explains how these areas are identified and why they should usually be treated as zones rather than exact prices.
The same principle applies near resistance. If a token approaches a previous resistance zone around ₹1,000 while RSI is above 70, traders may watch for rejection or weakening momentum. But strong demand could still push the price through resistance and keep RSI elevated.
Confirming RSI With MACD, Chart Patterns and Price Action
MACD is another momentum-based indicator, but it presents momentum differently. Traders may look for agreement between RSI, MACD and the price chart. For example, RSI may turn higher from a low level while MACD momentum also begins improving.
Chart patterns and price action can provide additional confirmation. A trader may wait for a higher low, a breakout above a short-term trend line, or a strong candle close before considering an RSI signal. Waiting for confirmation may lead to a later entry, but it can reduce the temptation to react to every indicator movement.
Confirmation does not mean certainty. RSI and MACD both use past price data, so they can give late or false signals. Using several similar indicators can also create the illusion of confirmation when all of them are responding to the same price movement.
Technical signals should also be considered alongside basic research. Before trading an unfamiliar token, review its purpose, token supply, project team, liquidity, exchange availability and major risks. The guide on researching a cryptocurrency before trading it covers these checks in more detail.
Common RSI Mistakes to Avoid
- Buying only because RSI crosses below 30: An oversold reading can continue while the price keeps falling. Look for context and confirmation.
- Selling only because RSI crosses above 70: Strong uptrends can keep RSI overbought for an extended period.
- Ignoring the main trend: Signals against a powerful trend may fail more often or produce only brief price moves.
- Using one setting everywhere: The standard 14-period RSI is common, but it may not suit every cryptocurrency, timeframe or trading style. Shorter settings respond faster but can create more noise.
- Forcing divergence: Not every difference between price and RSI is a useful divergence. The relevant peaks or lows should be clear and reasonably comparable.
- Confusing momentum with reversal confirmation: Falling momentum does not automatically mean price will reverse. A market can pause and then continue in the same direction.
- Overlooking low liquidity: Thinly traded tokens may have sudden price jumps, wide bid-ask spreads and unreliable indicator signals.
- Overtrading: Constantly reacting to small RSI changes can lead to unnecessary trades, fees and emotional decisions.
- Failing to manage risk: Traders should decide their acceptable loss, position size and exit conditions before entering a trade.
Limitations of RSI in Crypto Markets
Crypto markets trade continuously, including at night, on weekends and on public holidays. Prices can react quickly to regulation, exchange problems, security incidents, token listings, social-media activity or broader market sentiment.
RSI is based on historical price changes, so it is a lagging indicator. By the time it confirms a change in momentum, part of the price move may already have happened.
False signals are also common. RSI may briefly cross 30 or 70 and then return without producing a meaningful reversal. During powerful trends, it can remain at an extreme level for many candles. This is why an overbought reading should not automatically be interpreted as “too expensive”, and an oversold reading should not automatically be interpreted as “cheap”.
Timeframe choice also matters. An RSI signal on a five-minute chart may conflict with the trend on a four-hour or daily chart. Lower timeframes usually contain more market noise, while higher timeframes produce fewer but broader signals.
Frequently Asked Questions
What is the full form of RSI?
RSI stands for Relative Strength Index. It is a momentum oscillator that generally moves between 0 and 100 and measures the speed and size of recent price changes.
Does RSI predict cryptocurrency prices?
No. RSI describes recent momentum; it does not predict future prices with certainty. Unexpected news, liquidity changes and market sentiment can quickly invalidate a signal.
Does RSI below 30 mean I should buy?
Not necessarily. A reading below 30 is commonly described as oversold, but the price may continue falling. Check the main trend, support levels, liquidity and price action before making a decision.
Does RSI above 70 mean I should sell?
No automatic sell rule applies. RSI above 70 is commonly called overbought, but strong cryptocurrencies can remain overbought while their prices continue rising. Look for signs of weakening price action or other confirmation.
Why is a 14-period RSI commonly used?
Fourteen periods are common because that is the traditional default setting. On a daily chart, this uses 14 daily candles; on an hourly chart, it uses 14 hourly candles. It is a starting point rather than a universally best setting.
Which chart timeframe is suitable for RSI?
The suitable timeframe depends on the trader’s approach. Short-term traders may watch minute or hourly charts, while swing traders may prefer four-hour or daily charts. Beginners can compare a trading timeframe with a higher timeframe to understand the broader trend.
What is the difference between RSI and MACD?
RSI displays momentum on a bounded scale, usually from 0 to 100. MACD compares moving averages and is not restricted to a fixed range. Both can help assess momentum, but neither should be used as a guaranteed signal.
Does RSI work for every cryptocurrency?
RSI can be calculated for any cryptocurrency with sufficient price data, but its usefulness varies. Signals may be less reliable for new, illiquid or easily manipulated tokens. Always examine trading volume, spread and project-specific risks.
Summary
The RSI indicator crypto traders use can help identify momentum, extreme readings and possible divergence. Its signals become more useful when considered with the main trend, moving averages, MACD, support and resistance, chart patterns and price action.
Avoid treating 30 as an automatic buy level or 70 as an automatic sell level. Test settings carefully, pay attention to liquidity and use position sizing and exit rules to control risk.
Risk disclaimer: Cryptocurrency prices are highly volatile, and technical indicators can be wrong. This content is for education only and is not financial advice. Research every cryptocurrency independently and risk only money you can afford to lose.


Comments