

Crypto Support and Resistance Levels Explained: A Beginner’s Guide

A beginner-friendly guide to identifying and using support and resistance zones on cryptocurrency charts, with simple hypothetical examples and key risk warnings.

Crypto Support and Resistance Levels Explained: A Beginner’s Guide

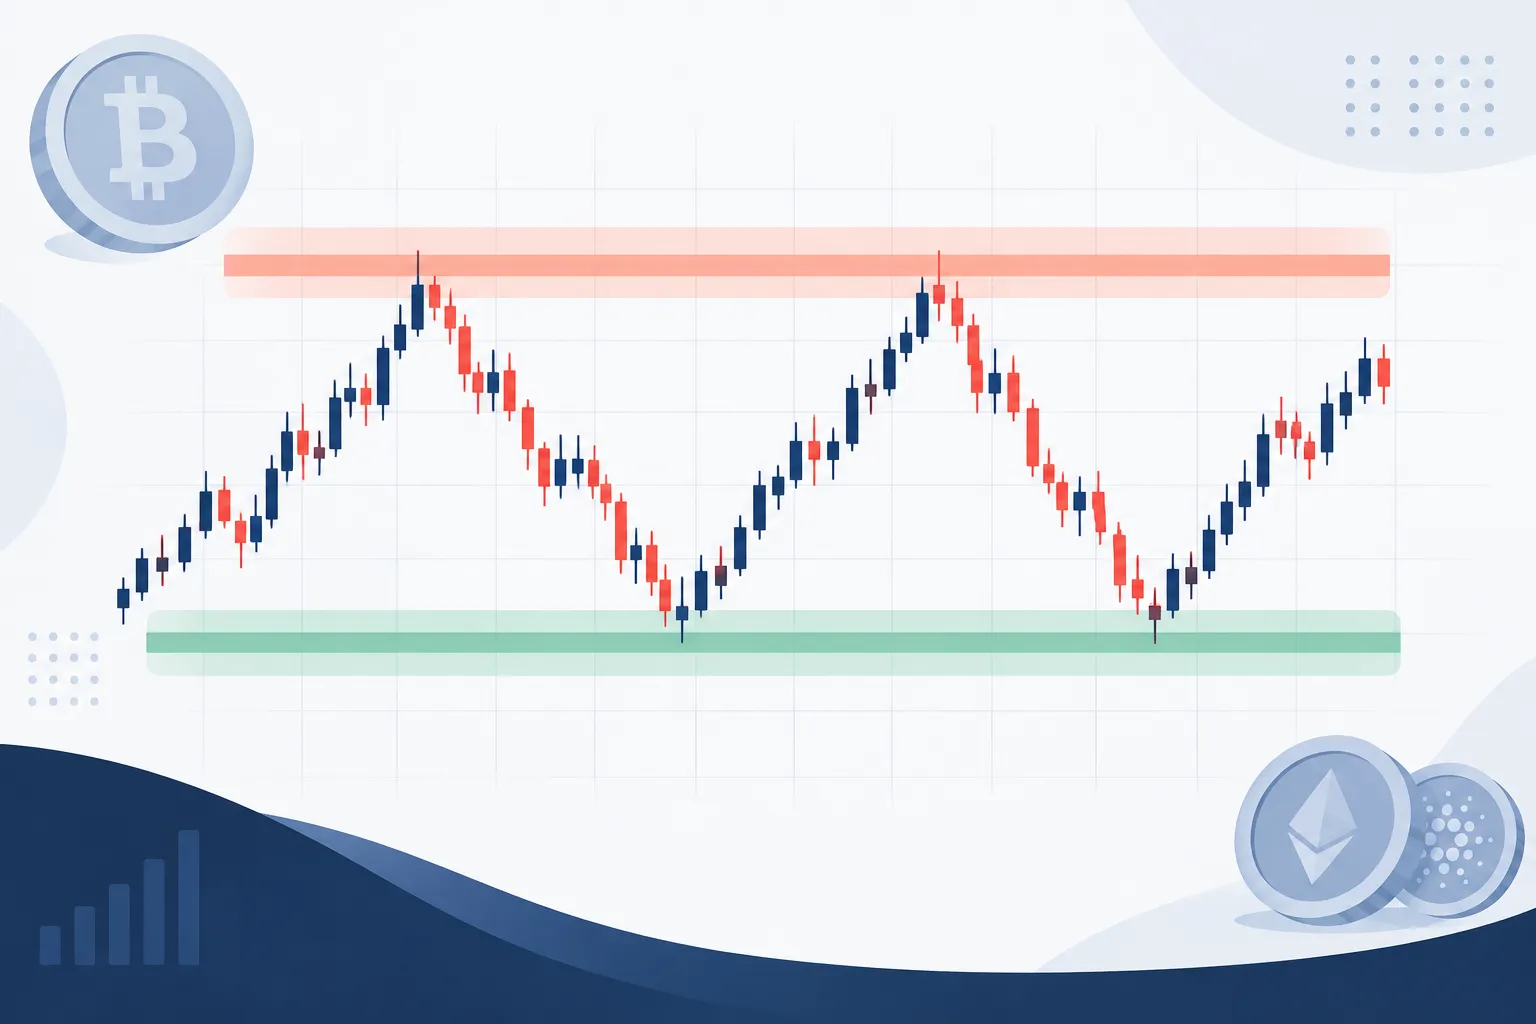
Crypto support and resistance levels are price areas where buying or selling pressure may become stronger. Support is an area where buyers may step in and slow a price fall. Resistance is an area where sellers may enter and slow a price rise.

These levels help traders identify possible entry points, exit points and risk areas. However, they are not guaranteed turning points. Crypto prices can break through support or resistance, sometimes very quickly. For this reason, traders usually treat a level as a price zone rather than one exact number.

Introduction

Open almost any crypto trading chart and you will see prices moving up and down in waves. A coin may fall to a certain area several times and then recover. It may also rise towards another area repeatedly but struggle to move higher.

These areas are commonly called support and resistance. They are among the most widely used ideas in crypto chart analysis because they provide a simple way to understand where market behaviour could change.

For example, suppose a cryptocurrency repeatedly falls towards ₹100 and then rebounds. Traders may begin to view the area near ₹100 as support. If the same cryptocurrency repeatedly rises towards ₹130 but falls back, the area near ₹130 may be viewed as resistance.

This does not mean the price must reverse at ₹100 or ₹130. It only means that previous trading activity suggests stronger buying or selling interest around those areas. New information, market sentiment, low liquidity or a sudden change in Bitcoin’s price can push the cryptocurrency through either level.

Beginners should therefore use crypto support and resistance levels as decision-making tools, not as predictions. They show where to pay closer attention. They do not tell you with certainty what will happen next.

Understanding Crypto Support and Resistance Levels

Support and resistance come from the interaction between buyers and sellers. Every trade requires both, but the urgency on each side can change as the price moves.

When a crypto asset becomes cheaper, more buyers may consider it attractive. Existing sellers may also become less willing to sell at the lower price. This combination can slow a decline and create support.

When the asset becomes more expensive, some holders may decide to book profits. Other traders may avoid buying at the higher price. This can increase selling pressure or reduce buying interest, creating resistance.

These areas are visible on price charts because traders often remember earlier price movements. If a cryptocurrency recovered strongly from a particular area in the past, market participants may watch that area when the price returns. Their orders and reactions can make the level relevant again.

What Is a Crypto Support Level?

A crypto support level is a price area where buying interest may be strong enough to slow or temporarily stop a decline. On a chart, it often appears below the current market price.

Imagine that a token falls from ₹80 to around ₹60 and then rises. A few days later, it returns to ₹61 and rebounds again. Traders may mark the ₹60 to ₹61 area as possible support because buyers have previously become active there.

Support can form for several reasons:

  • Traders may believe the cryptocurrency offers better value at the lower price.
  • Buy orders may already be waiting around that area.
  • Short-term sellers may decide to book profits on bearish trades.
  • Previous buyers may defend an area they consider important.
  • Traders may remember an earlier rebound and expect a similar reaction.

A support level does not create a price floor that cannot be crossed. If selling pressure becomes stronger than buying interest, the price can fall below support. This is often called a support breakdown.

For instance, a token may bounce from the ₹60 area several times but later fall to ₹54 after negative market news. The earlier support was still useful because it identified an important decision area. It simply did not hold on that occasion.

You May Also Like:Crypto Trading vs Long-Term Investing: Key Differences and Risks

What Is a Crypto Resistance Level?

A crypto resistance level is a price area where selling interest may be strong enough to slow or temporarily stop a rise. It normally appears above the current market price.

Suppose a coin rises towards ₹500 on three separate occasions but falls back each time. Traders may treat the area around ₹500 as resistance. Holders might be taking profits there, while new buyers may be unwilling to pay more.

Resistance may develop because:

  • Existing holders want to sell after the price reaches a previous high.
  • Traders who bought at that price earlier may sell when they get another chance to exit.
  • Short-term traders may expect the price to fall from the same area again.
  • Buyers may become cautious after a rapid rise.
  • Sell orders may be concentrated near a widely watched price.

Resistance is not a ceiling that must hold. Strong demand can push the price above it. This is commonly called a resistance breakout.

A breakout does not automatically mean that the price will continue rising. The move can fail, and the price can return below the resistance area. Traders often look for additional evidence before treating a breakout as meaningful.

Support Versus Resistance
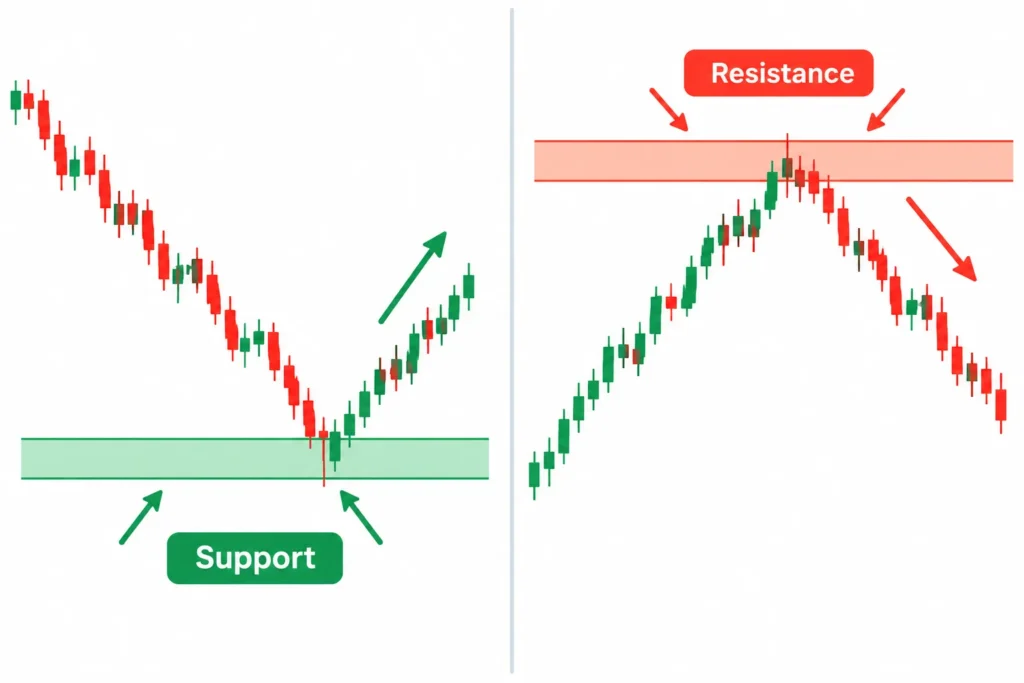
Comparison showing price rebounding from support and turning lower from resistance.

FeatureSupportResistance
Usual locationBelow the current priceAbove the current price
Main pressurePossible buying pressurePossible selling pressure
Possible effectMay slow or stop a price fallMay slow or stop a price rise
If the level failsPrice may break down below supportPrice may break out above resistance
How to interpret itAn area to watch for buyer activityAn area to watch for seller activity

The difference is mainly about where the level sits relative to the current price and which side may become more active. Both concepts describe possible changes in the balance between supply and demand.

A price area can also change its role. If the market moves above resistance and remains above it, that old resistance may later act as support. Similarly, broken support may become resistance if the price tries to recover. This happens because traders remember the area and adjust their orders around it.

Why Support and Resistance Are Zones, Not Exact Prices
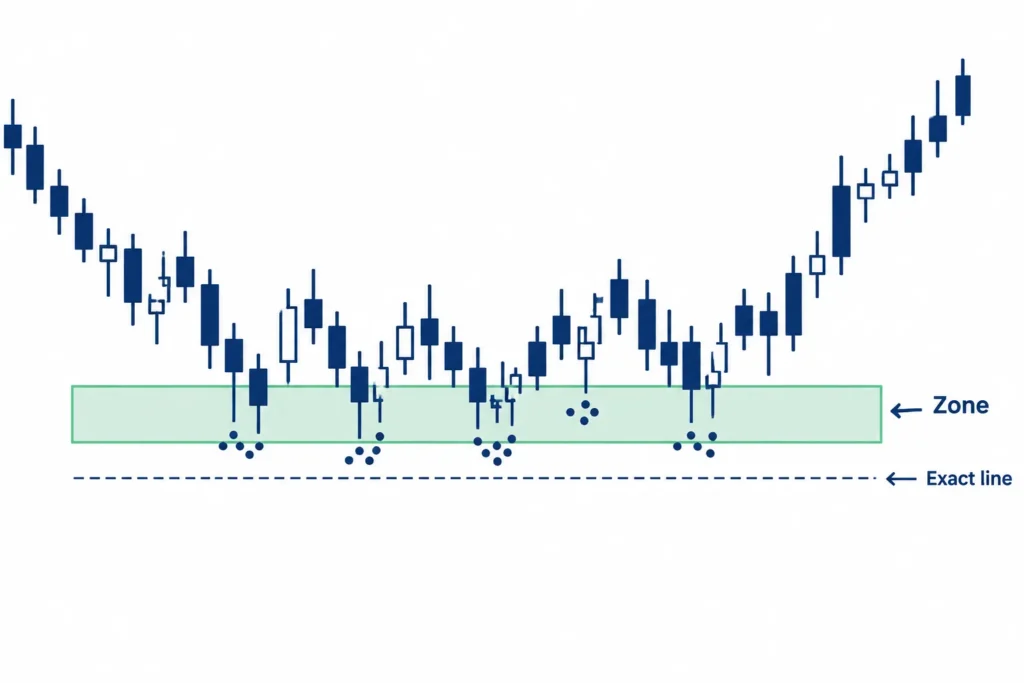
Several nearby price reactions grouped within a support zone instead of one exact line.

Beginners often draw support or resistance as a thin line at one exact price. A line is useful for keeping a chart clear, but real market activity rarely occurs at a single number.

Different traders place orders at slightly different prices. One buyer may enter at ₹99, another at ₹100 and another at ₹101. The combined activity creates an area of interest rather than a precise boundary.

Crypto markets can also move quickly. The price may briefly cross a marked level before reversing. If support is drawn at exactly ₹100, a fall to ₹99 may appear to be a breakdown. But if the broader support zone is ₹98 to ₹102, the same move may simply be normal activity inside that zone.

Round numbers can make zones especially noticeable. Prices such as ₹100, ₹1,000 or ₹10,000 are easy to remember, so traders may cluster orders near them. However, there is no rule that the market must reverse at a round number.

Consider a coin that has previously rebounded from ₹245, ₹248 and ₹252. Marking only ₹250 as support may give a misleading sense of precision. It is more practical to recognise a support zone around those nearby reactions.

The same principle applies to resistance. If a token has turned down from ₹790, ₹800 and ₹806, traders may view that broader region as resistance instead of assuming that ₹800 is an unbreakable ceiling.

Thinking in zones helps beginners avoid two common mistakes: expecting a perfect touch before the price reverses and assuming that a small move beyond a line has confirmed a breakout. A zone reflects how actual orders are spread across a range of prices.

The width of a zone depends on the cryptocurrency, its price volatility, the chart timeframe and recent market behaviour. It should not be made wider simply to fit every price movement. The purpose is to highlight a concentrated area of buying or selling reactions while accepting that markets are not exact.

In short, crypto support and resistance levels identify areas where market pressure may shift. Support points to possible buyer interest, while resistance points to possible seller interest. Both should be treated as flexible zones and possible reaction areas, never as guaranteed reversal prices.

How to Identify and Draw Support and Resistance Zones

Crypto support and resistance levels are rarely exact prices. It is usually more practical to mark them as zones: small price ranges where buyers or sellers have reacted several times.

For example, Bitcoin may repeatedly stop falling between ₹49,20,000 and ₹49,50,000. Instead of drawing one support line at ₹49,35,000, a trader could mark the entire range as a support zone. This accounts for normal price fluctuations and reduces the temptation to treat one number as perfect.

Start With Repeated Price Reactions

A useful zone usually has more than one visible price reaction. Look for areas where the market repeatedly changed direction, paused, or produced strong candles in the opposite direction.

When searching for possible support, look for an area where price fell and then bounced upward. If price returned to that area later and bounced again, the zone becomes more noticeable.

For possible resistance, look for an area where price rose and then turned downward. Repeated rejection from approximately the same range can make it more relevant.

Beginners should focus on clear reactions rather than trying to mark every small pause. A chart covered with many zones becomes difficult to read and may not help with decision-making.

You May Also Like:Stablecoins Explained: Types, Uses and Risks for Indian Beginners

Use Swing Highs and Swing Lows

A swing high is a visible peak where price rose, stopped, and moved lower. It may help identify a resistance zone.

A swing low is a visible bottom where price fell, stopped, and moved higher. It may help identify a support zone.

Consider a hypothetical crypto chart with these movements:

  • Price falls from ₹2,80,000 to ₹2,55,000 and then rises. The ₹2,55,000 area is a swing low.
  • Price climbs to ₹2,74,000 and then falls. The ₹2,74,000 area is a swing high.
  • Price later returns to ₹2,56,500 and rises again. This second reaction supports the idea of a support zone near the earlier swing low.
  • Price later reaches ₹2,73,000 and turns down. This may strengthen the resistance zone around the earlier swing high.

The two lows do not need to match exactly. Similarly, the two highs may differ. The purpose of a zone is to include nearby reactions that appear to represent the same broad area of buying or selling interest.

Step-by-Step Method for Drawing Zones

The following process can help beginners mark crypto support and resistance levels without making the chart unnecessarily complicated.

  1. Select the chart timeframe. If you plan to study price movements on a four-hour chart, begin there. Do not switch timeframes while marking the first set of reactions.
  2. Zoom out slightly. View enough price history to see several clear swings. Avoid zooming out so far that individual reactions become impossible to distinguish.
  3. Mark obvious swing lows. Find places where a decline clearly stopped and price moved upward. Give priority to areas tested more than once.
  4. Mark obvious swing highs. Find peaks where an advance stopped and price moved downward. Again, repeated reactions are generally easier to interpret.
  5. Draw rectangles instead of thin lines. Place the lower and upper boundaries around the cluster of candle bodies and wicks that produced the reactions.
  6. Keep the zone reasonably narrow. It should capture related reactions, not a large part of the chart. An extremely wide zone provides little practical information.
  7. Remove weak or crowded markings. If several zones sit very close together, retain the clearest area with the most obvious reactions.
  8. Check a higher timeframe. Compare the zone with a broader chart, such as the daily chart. This helps you understand whether the area is only a short-term reaction or part of a larger market structure.

How to Set the Zone Boundaries

There is no single mandatory rule for deciding the exact upper and lower boundaries. Some traders focus on candle bodies, while others include the full candle wicks. Beginners can use both as visual evidence.

Suppose a coin produces three lows:

  • The first candle closes near ₹995 and has a wick down to ₹980.
  • The second closes near ₹1,005 and has a wick down to ₹988.
  • The third reaches ₹992 before bouncing and closes near ₹1,012.

A possible support zone could extend from approximately ₹980 to ₹1,012. However, if most trading activity and candle closes are concentrated between ₹992 and ₹1,012, a beginner may choose that narrower range and treat the isolated ₹980 wick as an unusual extension.

The choice should remain consistent. Avoid changing a zone merely to make every later candle appear to respect it.

Compare the Trading Timeframe With Higher Timeframes

A zone may look important on a 15-minute chart but appear minor on a daily chart. This is why timeframe comparison matters.

The trading timeframe is the chart used for the immediate analysis. A higher timeframe shows a broader view. For example:

Trading timeframeUseful higher timeframe for comparison
15-minute chartOne-hour or four-hour chart
One-hour chartFour-hour or daily chart
Four-hour chartDaily or weekly chart
Daily chartWeekly chart

Mark the clearest zones on the higher timeframe first. Then return to the trading timeframe and refine them if needed. A daily zone may appear wide on an hourly chart, but it can still be more meaningful than a small hourly reaction.

Higher-timeframe zones do not guarantee a bounce or rejection. They simply show that the area has produced a significant reaction over a broader period.

Use Volume Only as Supporting Context

Volume shows how much trading activity occurred during a period. It can add context to a price reaction, but it should not be the only reason for drawing a zone.

For example, price may reach a previous support area and bounce with noticeably higher volume than nearby candles. This suggests that the reaction attracted stronger participation. A resistance rejection accompanied by higher volume may also deserve attention.

However, crypto volume data can differ across exchanges. One exchange may show activity that is not visible in the same way on another platform. Volume can also rise because of news, liquidations, or sudden volatility.

First identify the zone from price behaviour. Then check whether volume supports what the chart already shows. Do not create a support or resistance zone solely because one candle has high volume.

Fictional Bitcoin Chart Example

The following Bitcoin prices and outcomes are entirely fictional. They are provided only to explain the drawing process and are not real-time market data.

Imagine Bitcoin is being studied on a four-hour chart. Price falls to ₹49,30,000 and rebounds to ₹52,00,000. Several days later, it falls again, reaches ₹49,45,000, and rises. On a third test, a candle briefly touches ₹49,10,000 before closing at ₹49,55,000.

A trader could draw a support zone from ₹49,10,000 to ₹49,55,000. The lower boundary includes the deepest wick, while the upper boundary includes the cluster of closing prices and reversal candles.

Now imagine Bitcoin rises to ₹53,80,000 and turns lower. It later reaches ₹54,05,000 and falls again. A resistance zone could be marked from ₹53,80,000 to ₹54,05,000.

The trader then checks the daily chart. If the ₹49,10,000 to ₹49,55,000 range also contains an earlier daily swing low, the zone has higher-timeframe context. If the range is not visible on the daily chart, it may be mainly a four-hour zone.

Finally, the trader checks volume. If the second support bounce occurred with increased volume, that information may support the observed reaction. It does not prove that the zone will hold on the next visit. Price can pass through any support or resistance area.

You May Also Like:Crypto Mining Explained: How It Works, Costs and Risks

Keep the Chart Selective and Consistent

A useful chart may contain only a few major zones around the current price. Marking every historical turning point can create overlapping rectangles and conflicting signals.

Give priority to repeated reactions, clear swing highs and lows, and zones that remain visible on a higher timeframe. Draw each range using the same general method, and update it only when later price action provides meaningful new information.

Breakouts, Practical Uses, Risks, and FAQs

Crypto support and resistance levels do not hold forever. Price may move through a zone, test it again, and then continue in a new direction. Understanding this behaviour helps beginners read charts without treating every line as a fixed barrier.

What Is a Breakout?

A breakout happens when price moves beyond an established support or resistance zone. A move above resistance is called an upward breakout, while a move below support is called a downward breakout.

For example, suppose Bitcoin repeatedly struggles to move above ₹50 lakh. Traders may view the area around ₹50 lakh as resistance. If the price rises above this zone and remains there, the move may be treated as a possible breakout.

However, a brief move beyond a level is not always enough. Crypto prices can cross a zone for a few minutes and then quickly return. Traders often look for additional confirmation, such as:

  • A candle closing beyond the zone rather than only a wick crossing it.
  • Higher trading volume during the move.
  • Price remaining beyond the level for more than one candle.
  • A retest of the broken zone.
  • Similar evidence on a higher timeframe.

None of these signals confirms that a breakout must continue. They only provide more context.

False Breakouts and Retests
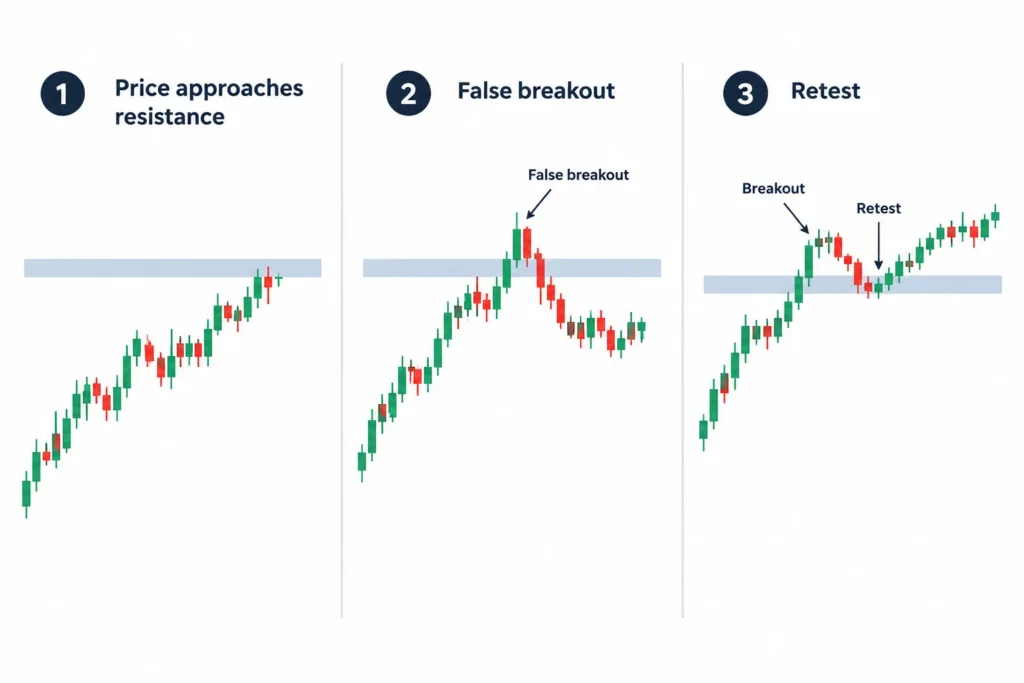
Timeline comparing a false breakout with a breakout and retest of former resistance.

A false breakout occurs when price moves beyond support or resistance but soon reverses. It may attract traders who expect the breakout to continue, only for the market to move in the opposite direction.

Imagine that Ether has resistance near ₹3 lakh. Its price briefly reaches ₹3.05 lakh but closes back below ₹3 lakh. That move could be a false upward breakout, especially if later candles remain below the resistance zone.

False breakouts are common in volatile cryptocurrency markets. They may happen because of sudden news, low liquidity, large orders, leveraged liquidations, or short-lived market excitement.

A retest happens when price breaks a level and later returns to the same area. The market then tests whether the old level will hold in its new role.

  • After an upward breakout, old resistance may act as new support.
  • After a downward breakout, old support may act as new resistance.

This behaviour is often called a support-resistance flip. For example, if a token breaks above resistance at ₹100, it may later fall towards ₹100 and find buyers there. The former resistance has then become possible support.

A retest does not always happen, and a tested level can still fail. Traders should avoid assuming that every breakout will return neatly to the same price.

Practical Uses of Support and Resistance

Support and resistance zones can help organise chart analysis. They are best used as reference areas rather than automatic buy or sell signals.

Chart interpretation: Levels can show where buyers or sellers previously became active. They may also help identify whether price is moving within a range, trending, or attempting a breakout.

Trade planning: A trader may use zones to consider different scenarios before taking a position. For example, the plan could account for price staying inside a range, breaking above resistance, or falling below support. This is more structured than reacting to every small price movement.

Risk management: Levels may help traders identify where their market idea would no longer make sense. Position size, exit planning, possible losses, fees, slippage, and available capital still need separate consideration.

Setting expectations: Nearby resistance may limit the immediate upside available in a proposed long trade. Nearby support may affect the downside space in a short trade. Comparing possible risk with possible reward can help avoid poorly planned trades, although the actual outcome remains uncertain.

These uses are educational examples, not personalised trading instructions. The relevance of any level depends on the asset, timeframe, liquidity, market conditions, and trading approach.

Common Mistakes to Avoid

  • Drawing too many levels: If every minor turning point becomes a line, the chart becomes difficult to read. Give more attention to zones that produced clear reactions or were tested several times.
  • Using only one timeframe: A level that looks important on a 15-minute chart may be minor on a daily chart. Checking a higher timeframe can provide broader context.
  • Ignoring volatility: Crypto prices can move sharply around news, major market events, or periods of low liquidity. Narrow lines may offer a false sense of precision.
  • Assuming a level cannot fail: Support is not a guaranteed floor, and resistance is not a guaranteed ceiling. Any zone can break.
  • Entering only because price touched a zone: A touch does not reveal whether buyers or sellers will take control. Some traders wait for a reaction, candle close, volume change, or another form of confirmation.
  • Forcing levels to fit a view: Lines should be based on visible price behaviour, not adjusted merely to support a bullish or bearish opinion.
  • Ignoring fees and slippage: Frequent trades around small price moves may be affected by exchange fees, taxes, spreads, and differences between expected and executed prices.
You May Also Like:Cryptocurrency vs Digital Currency: Key Differences Explained

Frequently Asked Questions

1. What are crypto support and resistance levels?

Support is an area where buying interest may slow or stop a price decline. Resistance is an area where selling interest may slow or stop a price rise. They are usually treated as zones because the market rarely reverses at one exact price.

2. How do beginners find support and resistance?

Start by looking for visible swing highs, swing lows, repeated price reactions, previous range boundaries, and major round numbers. Mark broad zones around these areas and check whether they remain meaningful on a higher timeframe.

3. Which timeframe is best for support and resistance?

There is no single best timeframe. Daily and weekly charts often show broader, more significant zones, while hourly or shorter charts provide more detail. The chosen timeframe should match the period being analysed. Using more than one timeframe can reduce the risk of relying on a minor level.

4. Does broken support become resistance?

It can, but it does not always happen. After price falls below support, sellers may become active if price returns to that zone. Similarly, broken resistance may become support after an upward breakout. Traders usually watch the retest rather than assuming the flip is automatic.

5. How can I tell whether a breakout is genuine?

No method can identify a genuine breakout with certainty. A close beyond the zone, stronger volume, continued movement, and a successful retest may add evidence. Even with these signs, price can reverse because market conditions change quickly.

6. Can support and resistance be used alone for trading?

They can help explain price structure, but relying on them alone may leave out important information. Traders may also consider trend, volume, volatility, liquidity, market news, position size, and maximum acceptable loss. Technical indicators can support analysis, but they cannot remove risk.

Summary

Crypto support and resistance levels are useful reference zones, not guaranteed turning points. Breakouts occur when price moves beyond a zone, while false breakouts quickly return inside it. A retest may lead to a support-resistance flip, but the level can still fail.

These zones can support chart interpretation, scenario planning, and risk awareness. Their value improves when traders keep charts simple, compare timeframes, account for volatility, and wait for context rather than acting on every touch.

Technical analysis studies past price and volume behaviour; it cannot predict the future with certainty. Cryptocurrency prices are highly volatile, and losses can occur quickly, including the loss of the entire amount committed. This article is for general education and is not financial, investment, tax, or legal advice. Consider your financial situation, conduct independent research, and consult a qualified professional where appropriate.


Share this article
KEEP READING

Related Articles

View all →

Comments

Leave a Comment

Crypto Support and Resistance Levels Explained: A Beginner’s Guide

Crypto support and resistance levels are price areas where buying or selling pressure may become stronger. Support is an area where buyers may step in and slow a price fall. Resistance is an area where sellers may enter and slow a price rise.

These levels help traders identify possible entry points, exit points and risk areas. However, they are not guaranteed turning points. Crypto prices can break through support or resistance, sometimes very quickly. For this reason, traders usually treat a level as a price zone rather than one exact number.

Introduction

Open almost any crypto trading chart and you will see prices moving up and down in waves. A coin may fall to a certain area several times and then recover. It may also rise towards another area repeatedly but struggle to move higher.

These areas are commonly called support and resistance. They are among the most widely used ideas in crypto chart analysis because they provide a simple way to understand where market behaviour could change.

For example, suppose a cryptocurrency repeatedly falls towards ₹100 and then rebounds. Traders may begin to view the area near ₹100 as support. If the same cryptocurrency repeatedly rises towards ₹130 but falls back, the area near ₹130 may be viewed as resistance.

This does not mean the price must reverse at ₹100 or ₹130. It only means that previous trading activity suggests stronger buying or selling interest around those areas. New information, market sentiment, low liquidity or a sudden change in Bitcoin’s price can push the cryptocurrency through either level.

Beginners should therefore use crypto support and resistance levels as decision-making tools, not as predictions. They show where to pay closer attention. They do not tell you with certainty what will happen next.

Understanding Crypto Support and Resistance Levels

Support and resistance come from the interaction between buyers and sellers. Every trade requires both, but the urgency on each side can change as the price moves.

When a crypto asset becomes cheaper, more buyers may consider it attractive. Existing sellers may also become less willing to sell at the lower price. This combination can slow a decline and create support.

When the asset becomes more expensive, some holders may decide to book profits. Other traders may avoid buying at the higher price. This can increase selling pressure or reduce buying interest, creating resistance.

These areas are visible on price charts because traders often remember earlier price movements. If a cryptocurrency recovered strongly from a particular area in the past, market participants may watch that area when the price returns. Their orders and reactions can make the level relevant again.

What Is a Crypto Support Level?

A crypto support level is a price area where buying interest may be strong enough to slow or temporarily stop a decline. On a chart, it often appears below the current market price.

Imagine that a token falls from ₹80 to around ₹60 and then rises. A few days later, it returns to ₹61 and rebounds again. Traders may mark the ₹60 to ₹61 area as possible support because buyers have previously become active there.

Support can form for several reasons:

  • Traders may believe the cryptocurrency offers better value at the lower price.
  • Buy orders may already be waiting around that area.
  • Short-term sellers may decide to book profits on bearish trades.
  • Previous buyers may defend an area they consider important.
  • Traders may remember an earlier rebound and expect a similar reaction.

A support level does not create a price floor that cannot be crossed. If selling pressure becomes stronger than buying interest, the price can fall below support. This is often called a support breakdown.

For instance, a token may bounce from the ₹60 area several times but later fall to ₹54 after negative market news. The earlier support was still useful because it identified an important decision area. It simply did not hold on that occasion.

What Is a Crypto Resistance Level?

A crypto resistance level is a price area where selling interest may be strong enough to slow or temporarily stop a rise. It normally appears above the current market price.

Suppose a coin rises towards ₹500 on three separate occasions but falls back each time. Traders may treat the area around ₹500 as resistance. Holders might be taking profits there, while new buyers may be unwilling to pay more.

Resistance may develop because:

  • Existing holders want to sell after the price reaches a previous high.
  • Traders who bought at that price earlier may sell when they get another chance to exit.
  • Short-term traders may expect the price to fall from the same area again.
  • Buyers may become cautious after a rapid rise.
  • Sell orders may be concentrated near a widely watched price.

Resistance is not a ceiling that must hold. Strong demand can push the price above it. This is commonly called a resistance breakout.

A breakout does not automatically mean that the price will continue rising. The move can fail, and the price can return below the resistance area. Traders often look for additional evidence before treating a breakout as meaningful.

Support Versus Resistance

Comparison showing price rebounding from support and turning lower from resistance.

FeatureSupportResistance
Usual locationBelow the current priceAbove the current price
Main pressurePossible buying pressurePossible selling pressure
Possible effectMay slow or stop a price fallMay slow or stop a price rise
If the level failsPrice may break down below supportPrice may break out above resistance
How to interpret itAn area to watch for buyer activityAn area to watch for seller activity

The difference is mainly about where the level sits relative to the current price and which side may become more active. Both concepts describe possible changes in the balance between supply and demand.

A price area can also change its role. If the market moves above resistance and remains above it, that old resistance may later act as support. Similarly, broken support may become resistance if the price tries to recover. This happens because traders remember the area and adjust their orders around it.

Why Support and Resistance Are Zones, Not Exact Prices

Several nearby price reactions grouped within a support zone instead of one exact line.

Beginners often draw support or resistance as a thin line at one exact price. A line is useful for keeping a chart clear, but real market activity rarely occurs at a single number.

Different traders place orders at slightly different prices. One buyer may enter at ₹99, another at ₹100 and another at ₹101. The combined activity creates an area of interest rather than a precise boundary.

Crypto markets can also move quickly. The price may briefly cross a marked level before reversing. If support is drawn at exactly ₹100, a fall to ₹99 may appear to be a breakdown. But if the broader support zone is ₹98 to ₹102, the same move may simply be normal activity inside that zone.

Round numbers can make zones especially noticeable. Prices such as ₹100, ₹1,000 or ₹10,000 are easy to remember, so traders may cluster orders near them. However, there is no rule that the market must reverse at a round number.

Consider a coin that has previously rebounded from ₹245, ₹248 and ₹252. Marking only ₹250 as support may give a misleading sense of precision. It is more practical to recognise a support zone around those nearby reactions.

The same principle applies to resistance. If a token has turned down from ₹790, ₹800 and ₹806, traders may view that broader region as resistance instead of assuming that ₹800 is an unbreakable ceiling.

Thinking in zones helps beginners avoid two common mistakes: expecting a perfect touch before the price reverses and assuming that a small move beyond a line has confirmed a breakout. A zone reflects how actual orders are spread across a range of prices.

The width of a zone depends on the cryptocurrency, its price volatility, the chart timeframe and recent market behaviour. It should not be made wider simply to fit every price movement. The purpose is to highlight a concentrated area of buying or selling reactions while accepting that markets are not exact.

In short, crypto support and resistance levels identify areas where market pressure may shift. Support points to possible buyer interest, while resistance points to possible seller interest. Both should be treated as flexible zones and possible reaction areas, never as guaranteed reversal prices.

How to Identify and Draw Support and Resistance Zones

Crypto support and resistance levels are rarely exact prices. It is usually more practical to mark them as zones: small price ranges where buyers or sellers have reacted several times.

For example, Bitcoin may repeatedly stop falling between ₹49,20,000 and ₹49,50,000. Instead of drawing one support line at ₹49,35,000, a trader could mark the entire range as a support zone. This accounts for normal price fluctuations and reduces the temptation to treat one number as perfect.

Start With Repeated Price Reactions

A useful zone usually has more than one visible price reaction. Look for areas where the market repeatedly changed direction, paused, or produced strong candles in the opposite direction.

When searching for possible support, look for an area where price fell and then bounced upward. If price returned to that area later and bounced again, the zone becomes more noticeable.

For possible resistance, look for an area where price rose and then turned downward. Repeated rejection from approximately the same range can make it more relevant.

Beginners should focus on clear reactions rather than trying to mark every small pause. A chart covered with many zones becomes difficult to read and may not help with decision-making.

Use Swing Highs and Swing Lows

A swing high is a visible peak where price rose, stopped, and moved lower. It may help identify a resistance zone.

A swing low is a visible bottom where price fell, stopped, and moved higher. It may help identify a support zone.

Consider a hypothetical crypto chart with these movements:

  • Price falls from ₹2,80,000 to ₹2,55,000 and then rises. The ₹2,55,000 area is a swing low.
  • Price climbs to ₹2,74,000 and then falls. The ₹2,74,000 area is a swing high.
  • Price later returns to ₹2,56,500 and rises again. This second reaction supports the idea of a support zone near the earlier swing low.
  • Price later reaches ₹2,73,000 and turns down. This may strengthen the resistance zone around the earlier swing high.

The two lows do not need to match exactly. Similarly, the two highs may differ. The purpose of a zone is to include nearby reactions that appear to represent the same broad area of buying or selling interest.

Step-by-Step Method for Drawing Zones

The following process can help beginners mark crypto support and resistance levels without making the chart unnecessarily complicated.

  1. Select the chart timeframe. If you plan to study price movements on a four-hour chart, begin there. Do not switch timeframes while marking the first set of reactions.
  2. Zoom out slightly. View enough price history to see several clear swings. Avoid zooming out so far that individual reactions become impossible to distinguish.
  3. Mark obvious swing lows. Find places where a decline clearly stopped and price moved upward. Give priority to areas tested more than once.
  4. Mark obvious swing highs. Find peaks where an advance stopped and price moved downward. Again, repeated reactions are generally easier to interpret.
  5. Draw rectangles instead of thin lines. Place the lower and upper boundaries around the cluster of candle bodies and wicks that produced the reactions.
  6. Keep the zone reasonably narrow. It should capture related reactions, not a large part of the chart. An extremely wide zone provides little practical information.
  7. Remove weak or crowded markings. If several zones sit very close together, retain the clearest area with the most obvious reactions.
  8. Check a higher timeframe. Compare the zone with a broader chart, such as the daily chart. This helps you understand whether the area is only a short-term reaction or part of a larger market structure.

How to Set the Zone Boundaries

There is no single mandatory rule for deciding the exact upper and lower boundaries. Some traders focus on candle bodies, while others include the full candle wicks. Beginners can use both as visual evidence.

Suppose a coin produces three lows:

  • The first candle closes near ₹995 and has a wick down to ₹980.
  • The second closes near ₹1,005 and has a wick down to ₹988.
  • The third reaches ₹992 before bouncing and closes near ₹1,012.

A possible support zone could extend from approximately ₹980 to ₹1,012. However, if most trading activity and candle closes are concentrated between ₹992 and ₹1,012, a beginner may choose that narrower range and treat the isolated ₹980 wick as an unusual extension.

The choice should remain consistent. Avoid changing a zone merely to make every later candle appear to respect it.

Compare the Trading Timeframe With Higher Timeframes

A zone may look important on a 15-minute chart but appear minor on a daily chart. This is why timeframe comparison matters.

The trading timeframe is the chart used for the immediate analysis. A higher timeframe shows a broader view. For example:

Trading timeframeUseful higher timeframe for comparison
15-minute chartOne-hour or four-hour chart
One-hour chartFour-hour or daily chart
Four-hour chartDaily or weekly chart
Daily chartWeekly chart

Mark the clearest zones on the higher timeframe first. Then return to the trading timeframe and refine them if needed. A daily zone may appear wide on an hourly chart, but it can still be more meaningful than a small hourly reaction.

Higher-timeframe zones do not guarantee a bounce or rejection. They simply show that the area has produced a significant reaction over a broader period.

Use Volume Only as Supporting Context

Volume shows how much trading activity occurred during a period. It can add context to a price reaction, but it should not be the only reason for drawing a zone.

For example, price may reach a previous support area and bounce with noticeably higher volume than nearby candles. This suggests that the reaction attracted stronger participation. A resistance rejection accompanied by higher volume may also deserve attention.

However, crypto volume data can differ across exchanges. One exchange may show activity that is not visible in the same way on another platform. Volume can also rise because of news, liquidations, or sudden volatility.

First identify the zone from price behaviour. Then check whether volume supports what the chart already shows. Do not create a support or resistance zone solely because one candle has high volume.

Fictional Bitcoin Chart Example

The following Bitcoin prices and outcomes are entirely fictional. They are provided only to explain the drawing process and are not real-time market data.

Imagine Bitcoin is being studied on a four-hour chart. Price falls to ₹49,30,000 and rebounds to ₹52,00,000. Several days later, it falls again, reaches ₹49,45,000, and rises. On a third test, a candle briefly touches ₹49,10,000 before closing at ₹49,55,000.

A trader could draw a support zone from ₹49,10,000 to ₹49,55,000. The lower boundary includes the deepest wick, while the upper boundary includes the cluster of closing prices and reversal candles.

Now imagine Bitcoin rises to ₹53,80,000 and turns lower. It later reaches ₹54,05,000 and falls again. A resistance zone could be marked from ₹53,80,000 to ₹54,05,000.

The trader then checks the daily chart. If the ₹49,10,000 to ₹49,55,000 range also contains an earlier daily swing low, the zone has higher-timeframe context. If the range is not visible on the daily chart, it may be mainly a four-hour zone.

Finally, the trader checks volume. If the second support bounce occurred with increased volume, that information may support the observed reaction. It does not prove that the zone will hold on the next visit. Price can pass through any support or resistance area.

Keep the Chart Selective and Consistent

A useful chart may contain only a few major zones around the current price. Marking every historical turning point can create overlapping rectangles and conflicting signals.

Give priority to repeated reactions, clear swing highs and lows, and zones that remain visible on a higher timeframe. Draw each range using the same general method, and update it only when later price action provides meaningful new information.

Breakouts, Practical Uses, Risks, and FAQs

Crypto support and resistance levels do not hold forever. Price may move through a zone, test it again, and then continue in a new direction. Understanding this behaviour helps beginners read charts without treating every line as a fixed barrier.

What Is a Breakout?

A breakout happens when price moves beyond an established support or resistance zone. A move above resistance is called an upward breakout, while a move below support is called a downward breakout.

For example, suppose Bitcoin repeatedly struggles to move above ₹50 lakh. Traders may view the area around ₹50 lakh as resistance. If the price rises above this zone and remains there, the move may be treated as a possible breakout.

However, a brief move beyond a level is not always enough. Crypto prices can cross a zone for a few minutes and then quickly return. Traders often look for additional confirmation, such as:

  • A candle closing beyond the zone rather than only a wick crossing it.
  • Higher trading volume during the move.
  • Price remaining beyond the level for more than one candle.
  • A retest of the broken zone.
  • Similar evidence on a higher timeframe.

None of these signals confirms that a breakout must continue. They only provide more context.

False Breakouts and Retests

Timeline comparing a false breakout with a breakout and retest of former resistance.

A false breakout occurs when price moves beyond support or resistance but soon reverses. It may attract traders who expect the breakout to continue, only for the market to move in the opposite direction.

Imagine that Ether has resistance near ₹3 lakh. Its price briefly reaches ₹3.05 lakh but closes back below ₹3 lakh. That move could be a false upward breakout, especially if later candles remain below the resistance zone.

False breakouts are common in volatile cryptocurrency markets. They may happen because of sudden news, low liquidity, large orders, leveraged liquidations, or short-lived market excitement.

A retest happens when price breaks a level and later returns to the same area. The market then tests whether the old level will hold in its new role.

  • After an upward breakout, old resistance may act as new support.
  • After a downward breakout, old support may act as new resistance.

This behaviour is often called a support-resistance flip. For example, if a token breaks above resistance at ₹100, it may later fall towards ₹100 and find buyers there. The former resistance has then become possible support.

A retest does not always happen, and a tested level can still fail. Traders should avoid assuming that every breakout will return neatly to the same price.

Practical Uses of Support and Resistance

Support and resistance zones can help organise chart analysis. They are best used as reference areas rather than automatic buy or sell signals.

Chart interpretation: Levels can show where buyers or sellers previously became active. They may also help identify whether price is moving within a range, trending, or attempting a breakout.

Trade planning: A trader may use zones to consider different scenarios before taking a position. For example, the plan could account for price staying inside a range, breaking above resistance, or falling below support. This is more structured than reacting to every small price movement.

Risk management: Levels may help traders identify where their market idea would no longer make sense. Position size, exit planning, possible losses, fees, slippage, and available capital still need separate consideration.

Setting expectations: Nearby resistance may limit the immediate upside available in a proposed long trade. Nearby support may affect the downside space in a short trade. Comparing possible risk with possible reward can help avoid poorly planned trades, although the actual outcome remains uncertain.

These uses are educational examples, not personalised trading instructions. The relevance of any level depends on the asset, timeframe, liquidity, market conditions, and trading approach.

Common Mistakes to Avoid

  • Drawing too many levels: If every minor turning point becomes a line, the chart becomes difficult to read. Give more attention to zones that produced clear reactions or were tested several times.
  • Using only one timeframe: A level that looks important on a 15-minute chart may be minor on a daily chart. Checking a higher timeframe can provide broader context.
  • Ignoring volatility: Crypto prices can move sharply around news, major market events, or periods of low liquidity. Narrow lines may offer a false sense of precision.
  • Assuming a level cannot fail: Support is not a guaranteed floor, and resistance is not a guaranteed ceiling. Any zone can break.
  • Entering only because price touched a zone: A touch does not reveal whether buyers or sellers will take control. Some traders wait for a reaction, candle close, volume change, or another form of confirmation.
  • Forcing levels to fit a view: Lines should be based on visible price behaviour, not adjusted merely to support a bullish or bearish opinion.
  • Ignoring fees and slippage: Frequent trades around small price moves may be affected by exchange fees, taxes, spreads, and differences between expected and executed prices.

Frequently Asked Questions

1. What are crypto support and resistance levels?

Support is an area where buying interest may slow or stop a price decline. Resistance is an area where selling interest may slow or stop a price rise. They are usually treated as zones because the market rarely reverses at one exact price.

2. How do beginners find support and resistance?

Start by looking for visible swing highs, swing lows, repeated price reactions, previous range boundaries, and major round numbers. Mark broad zones around these areas and check whether they remain meaningful on a higher timeframe.

3. Which timeframe is best for support and resistance?

There is no single best timeframe. Daily and weekly charts often show broader, more significant zones, while hourly or shorter charts provide more detail. The chosen timeframe should match the period being analysed. Using more than one timeframe can reduce the risk of relying on a minor level.

4. Does broken support become resistance?

It can, but it does not always happen. After price falls below support, sellers may become active if price returns to that zone. Similarly, broken resistance may become support after an upward breakout. Traders usually watch the retest rather than assuming the flip is automatic.

5. How can I tell whether a breakout is genuine?

No method can identify a genuine breakout with certainty. A close beyond the zone, stronger volume, continued movement, and a successful retest may add evidence. Even with these signs, price can reverse because market conditions change quickly.

6. Can support and resistance be used alone for trading?

They can help explain price structure, but relying on them alone may leave out important information. Traders may also consider trend, volume, volatility, liquidity, market news, position size, and maximum acceptable loss. Technical indicators can support analysis, but they cannot remove risk.

Summary

Crypto support and resistance levels are useful reference zones, not guaranteed turning points. Breakouts occur when price moves beyond a zone, while false breakouts quickly return inside it. A retest may lead to a support-resistance flip, but the level can still fail.

These zones can support chart interpretation, scenario planning, and risk awareness. Their value improves when traders keep charts simple, compare timeframes, account for volatility, and wait for context rather than acting on every touch.

Technical analysis studies past price and volume behaviour; it cannot predict the future with certainty. Cryptocurrency prices are highly volatile, and losses can occur quickly, including the loss of the entire amount committed. This article is for general education and is not financial, investment, tax, or legal advice. Consider your financial situation, conduct independent research, and consult a qualified professional where appropriate.
Leave a Comment