

Quick Answer
Moving averages in crypto are technical indicators that smooth past price data to make a trend easier to see. A Simple Moving Average, or SMA, gives equal importance to every price in the selected period. An Exponential Moving Average, or EMA, gives more importance to recent prices, so it usually reacts faster when the market moves.
Both are lagging indicators. They describe what prices have already done; they do not predict the next price or guarantee a profitable trading signal. The EMA is more responsive, but that does not make it automatically better than the SMA.
Introduction
Crypto prices can move quickly and unevenly. A Bitcoin or Ether chart may show several sharp rises and falls within a short time, making it difficult for a beginner to identify the broader direction.
A moving average reduces some of this visual noise. Instead of focusing on every small price change, it calculates an average over a chosen number of periods and plots that value on the chart. As each new period arrives, the oldest data is removed or given less influence, so the average “moves” with the market.
Traders use moving averages to study trend direction and momentum. For example, a rising moving average may support the view that prices have generally been moving upwards. A falling average may indicate a broader downward trend. Traders also watch how the price behaves around an average or how two averages interact.
However, moving averages are based only on historical price data. They can react late, produce false signals and become less useful when prices move sideways. They should not be treated as predictions, guarantees or standalone instructions to buy or sell.
This section explains the two most common types: the Simple Moving Average and the Exponential Moving Average. These concepts also support the wider topics covered in Crypto Trading & Technical Analysis: A Practical Guide, How to Read Crypto Charts and Crypto Trading for Beginners.
Understanding Moving Averages, SMA and EMA
What Is a Moving Average?
A moving average is a lagging technical indicator that smooths past price data over a selected number of periods. “Lagging” means it responds after the underlying price has moved because its calculation uses historical information.
Most charting platforms calculate moving averages from closing prices by default, although some allow traders to use opening, high or low prices instead. The selected period could represent minutes, hours, days or weeks, depending on the chart.
A moving average can help answer simple questions such as:
- Is the broader trend rising, falling or mostly flat?
- Is recent momentum becoming stronger or weaker?
- Is the current price far above or below its recent average?
- Are short-term and long-term trends moving in the same direction?
These observations provide context, not certainty. A rising average does not mean the price must continue rising. News, regulation, liquidity, market sentiment and sudden large orders can quickly change a crypto trend.
Simple Moving Average: Equal Weight for Every Price
The Simple Moving Average gives equal weight to every observation in the chosen period. In a 20-period SMA, for example, each of the 20 closing prices contributes equally to the result.
SMA = sum of closing prices over n periods ÷ n
Here, n is the number of periods selected. If a token has closing prices of ₹100, ₹102, ₹101 and ₹103 across four periods, its four-period SMA is:
(₹100 + ₹102 + ₹101 + ₹103) ÷ 4 = ₹101.50
When the next period closes, the calculation drops the oldest closing price and includes the newest one. This process creates the moving line visible on a chart.
Because all observations have equal importance, an SMA tends to be relatively smooth. This can help traders focus on the broader trend rather than every short-lived price jump. The trade-off is that it can respond slowly when the market changes direction.
Exponential Moving Average: More Weight on Recent Prices
The Exponential Moving Average gives greater weight to recent prices and progressively less weight to older prices. It still uses historical data, but it responds more quickly than an SMA of the same period.
The first step is to calculate the weighting multiplier:
EMA multiplier = 2 ÷ (n + 1)
The EMA can then be updated with the following formula:
EMA = (current price − previous EMA) × multiplier + previous EMA
For a four-period EMA, the multiplier is:
2 ÷ (4 + 1) = 0.40
An EMA calculation requires a starting value. A charting system may use an SMA as the initial value and then continue the EMA calculation as new prices arrive. Small differences in initialisation can sometimes cause minor differences between platforms, especially near the beginning of a data series.
Illustration: Why an EMA Reacts Faster
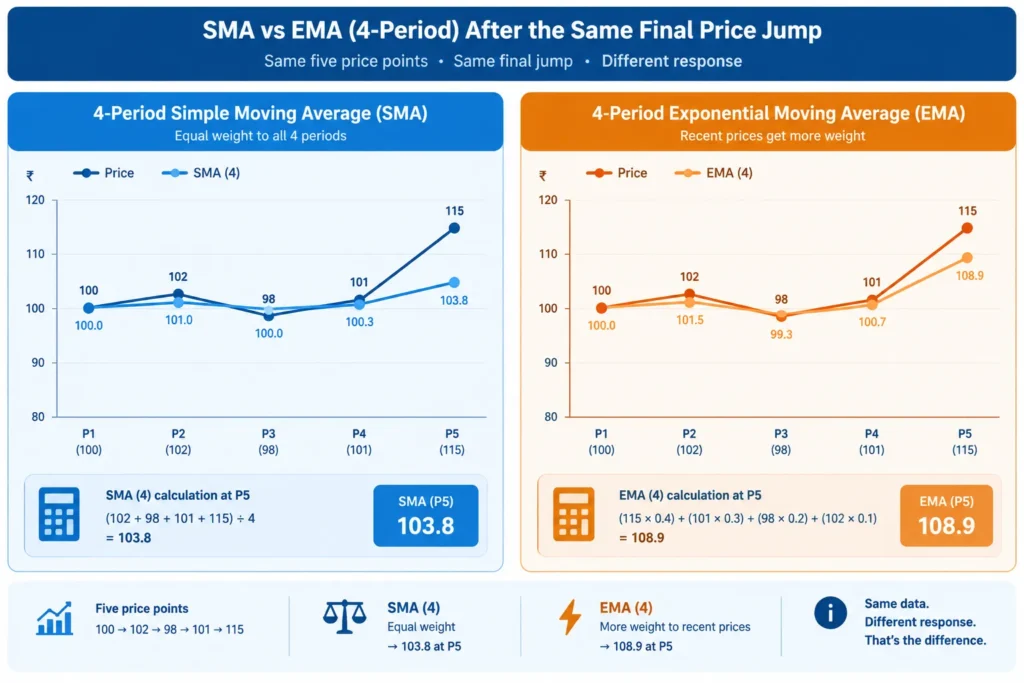
The following is a simplified illustration, not historical crypto market data. Assume five consecutive closing prices are ₹100, ₹102, ₹101, ₹103 and ₹110.
After the first four closes, the four-period SMA is ₹101.50. For this illustration, use that figure as the previous EMA value. The fifth close then jumps to ₹110.
The new four-period SMA uses the latest four prices:
(₹102 + ₹101 + ₹103 + ₹110) ÷ 4 = ₹104
The updated four-period EMA uses the 0.40 multiplier:
(₹110 − ₹101.50) × 0.40 + ₹101.50 = ₹104.90
The EMA rises to ₹104.90, while the SMA rises to ₹104. The EMA reacts more strongly because the newest price receives greater weight. If the latest price had fallen sharply instead, the EMA would generally have reacted faster in the downward direction as well.
This faster response has both benefits and costs. It may highlight a change earlier, but it may also react to a temporary price spike that quickly reverses.
SMA vs EMA: Key Differences
| Factor | Simple Moving Average | Exponential Moving Average |
|---|---|---|
| Weighting | Gives equal weight to every closing price in the selected period. | Gives greater weight to recent prices and less weight to older prices. |
| Speed of response | Usually responds more slowly to a new price move. | Usually responds faster to a new price move. |
| Smoothness | Often produces a smoother line that filters more short-term noise. | Can move more sharply as recent prices change. |
| Lag | Generally has more lag than an EMA of the same period. | Generally has less lag than an SMA of the same period, but it still lags price. |
| Common uses | Studying broader trends, long-term direction and relatively stable support or resistance areas. | Monitoring short-term momentum, recent trend changes and faster moving-average crossovers. |
| Strengths | Simple to understand, transparent to calculate and less sensitive to isolated price moves. | More responsive when market conditions change and gives recent information greater influence. |
| Limitations | May react late during a rapid reversal and can keep reflecting older prices for longer. | May generate more false signals in volatile or sideways markets and can overreact to short-lived moves. |
The EMA is not always better than the SMA. A short-term trader may prefer the EMA’s responsiveness, while a trader studying a wider trend may value the smoother SMA. Some traders display both, but adding more indicators does not remove uncertainty.
What Does a “20-Period” Moving Average Mean?
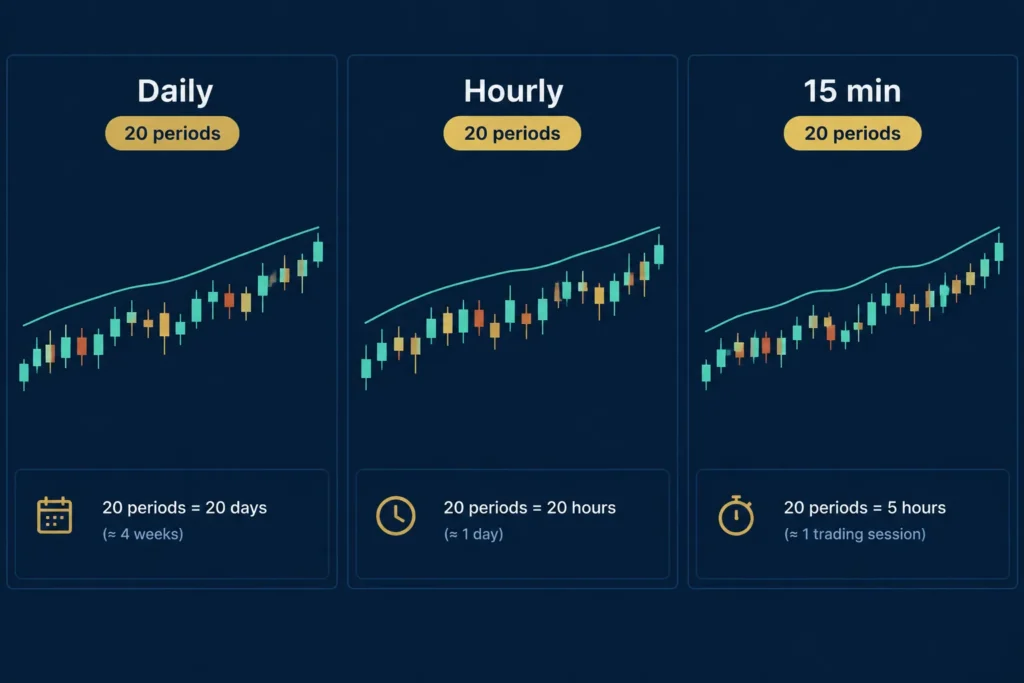
The word “period” refers to one candle or price bar on the selected chart. Therefore, a 20-period moving average does not always represent the same amount of time.
- On a daily chart, a 20-period moving average uses 20 daily candles.
- On an hourly chart, it uses 20 hourly candles.
- On a 15-minute chart, it uses 20 candles of 15 minutes each.
A 20-period average on a daily chart therefore reflects a much broader trend than a 20-period average on an hourly chart. Before interpreting any moving average, check both its period setting and the chart timeframe. A signal that looks important on an hourly chart may be only a small fluctuation within the larger daily trend.
Using Moving Averages to Read Crypto Trends and Crossovers
Moving averages help traders simplify noisy crypto price charts. Instead of reacting to every candle, a trader can use an average to judge the broader direction of price.
In moving averages crypto analysis, the chosen period matters. A 20-period average reacts relatively quickly, while a 200-period average changes more slowly. Neither is automatically better. The right choice depends on the trading timeframe, the crypto asset and the purpose of the analysis.
A “period” refers to the number of candles included in the calculation. On a daily chart, a 20-period moving average uses 20 daily candles. On a one-hour chart, it uses 20 hourly candles. This distinction is important because the same setting can communicate very different information across timeframes.
What 20, 50, 100 and 200-Period Moving Averages May Show
Traders commonly watch a few moving-average periods. These are conventions rather than compulsory settings.
- 20-period moving average: Often used to observe short-term momentum. It follows price more closely but may also produce more noise and frequent direction changes.
- 50-period moving average: Often used to assess an intermediate trend. It is slower than the 20-period average but still responds sooner than longer averages.
- 100-period moving average: May provide a broader view of the medium-to-long-term trend. Some traders use it as an additional reference between the 50-period and 200-period averages.
- 200-period moving average: Commonly used as a long-term trend reference. Because it includes many candles, it responds slowly to recent price changes.
Both simple moving averages and exponential moving averages can be used with these periods. An EMA gives more weight to recent prices, so it generally reacts faster than an SMA using the same period. Faster reactions can be useful, but they can also lead to more false signals when the market is unstable.
There is no universally best combination. A short-term trader looking at 15-minute candles may interpret a 20-period EMA differently from a long-term investor studying a 200-day SMA. Testing settings on the relevant asset and timeframe is more sensible than assuming that a popular setting will always work.
Reading Price Position, Slope and Alignment
A moving average should not be read only as a line that price crosses. Traders often examine three connected factors: where price is located, which way the average is sloping, and how multiple averages are arranged.
Price position shows whether the current market price is above or below the average. Price staying above an average may suggest that buyers have maintained control over that period. Price remaining below it may suggest continued selling pressure.
Slope refers to the direction of the moving average. A rising average suggests that the prices included in the calculation are generally moving higher. A falling average suggests the opposite. A nearly flat average may indicate that price has not established a clear direction.
Alignment compares multiple averages. A chart may look broadly bullish when shorter averages are above longer averages and several of them are rising. It may look broadly bearish when shorter averages are below longer averages and the averages are falling.
Alignment is not proof that the trend will continue. Crypto prices can reverse quickly because of market sentiment, regulatory news, large liquidations or changes in liquidity.
Hypothetical Bullish and Bearish Examples
Consider a hypothetical Bitcoin daily chart. Price moves above a rising 50-day moving average and continues to close above it during several pullbacks. The average also keeps sloping upward. This combination may suggest a bullish trend because price is holding above an improving medium-term reference.
A trader would still avoid assuming that every touch of the average must lead to another rise. A decisive close below it, a flattening slope or weakening market structure could challenge the bullish reading.
Now consider a hypothetical Ether four-hour chart. Price stays below a falling 20-period EMA, and repeated recovery attempts fail near the line. This may suggest a bearish short-term trend. The falling EMA reflects declining recent prices, while price remaining below it indicates that buyers have not yet regained control.
The bearish reading is not certain either. Price could move above the EMA and begin forming higher highs and higher lows. The moving average would respond only after price had already started changing direction.
Recognising a Sideways Market
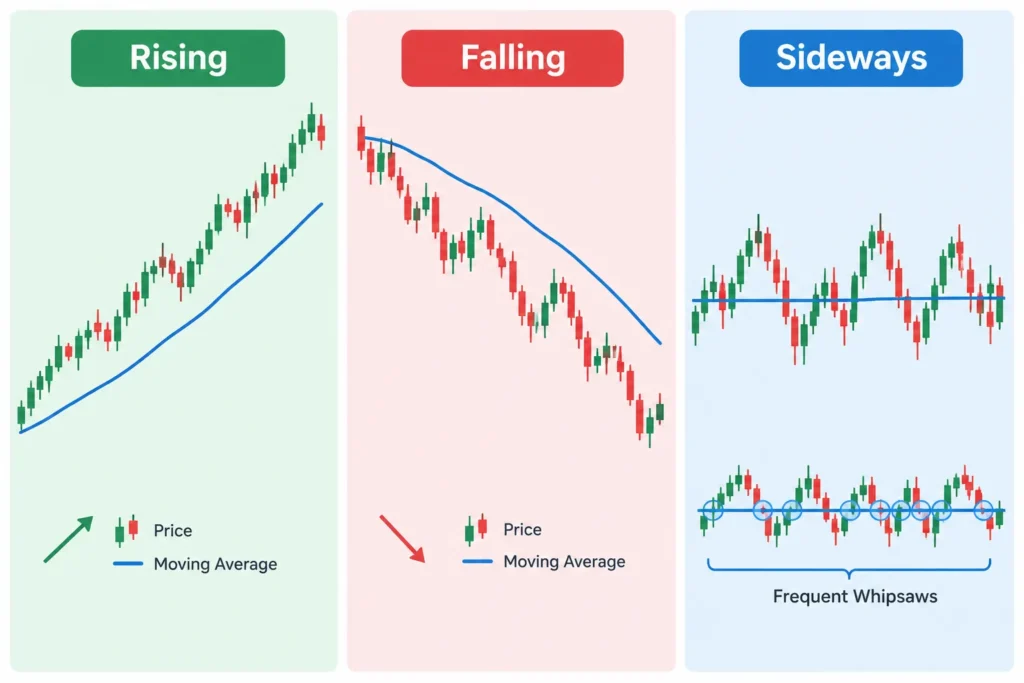
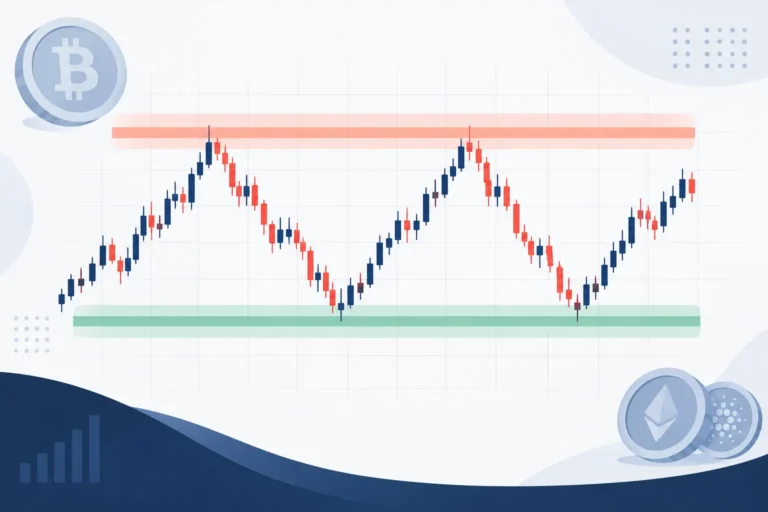
Moving averages become less useful as trend signals when the market is moving sideways. In such conditions, an average may become nearly flat while price crosses above and below it repeatedly.
For example, suppose a crypto token trades within a narrow range for several days. Its 20-period EMA may flatten, with candles repeatedly closing on both sides. A trader treating every cross as a new trend signal could enter and exit several times without a clear directional move.
Frequent crosses, flat slopes and tightly grouped averages may therefore suggest consolidation rather than a strong trend. Waiting for price to leave the range, and then checking whether the moving averages begin to slope and separate, can provide more context.
Moving Averages as Dynamic Support and Resistance
Moving averages may also act as areas of dynamic support or resistance. They are called dynamic because their values change as new candles are added, unlike a fixed horizontal level.
In an uptrend, price may pull back towards a rising moving average and then recover. Traders may view the area around the average as potential support. In a downtrend, price may rise towards a falling average and then turn lower, making the area potential resistance.
These reactions are not guaranteed. Price can pass through a moving average without pausing, especially during sharp market moves. It is usually better to treat the line as a zone of interest rather than an exact price at which a reversal must happen.
This idea connects closely with Crypto Support and Resistance Levels. A moving average may become more meaningful when it is near a horizontal support or resistance zone, a previous swing high or a previous swing low. Even then, the combination provides context rather than certainty.
How Moving Average Crossovers Work
A crossover occurs when one moving average moves above or below another. Traders typically compare a shorter-term average with a longer-term average.
When the shorter-term average crosses above the longer-term average, it may signal that recent price momentum is becoming stronger than the broader trend. When the shorter-term average crosses below the longer-term average, it may indicate weakening momentum.
For a hypothetical short-term example, imagine a 20-period EMA crossing above a 50-period EMA on a four-hour crypto chart. The cross may suggest improving momentum. A trader might then check whether price has also moved above resistance, whether both averages are beginning to rise and whether the broader market supports the move.
In a bearish example, the 20-period EMA crosses below the 50-period EMA while price breaks below a recent support zone. This may strengthen the bearish interpretation. However, if price quickly returns above both averages, the cross may turn out to be a false signal.
Golden Cross and Death Cross
A Golden Cross occurs when a shorter-term moving average, commonly the 50-period average, crosses above a longer-term moving average, commonly the 200-period average. It is generally interpreted as a potential bullish long-term signal.
For example, suppose the 50-day SMA on a hypothetical Bitcoin chart rises above the 200-day SMA after price has been recovering for some time. Traders may interpret this as evidence that the medium-term trend has improved relative to the long-term trend.
A Death Cross is the reverse. It occurs when the shorter-term average, commonly the 50-period average, crosses below the longer-term average, commonly the 200-period average. It is generally viewed as a potential bearish long-term signal.
For example, if a token has already been declining and its 50-day SMA later drops below its 200-day SMA, the cross may confirm that weakness has persisted. It does not necessarily identify the start of the decline because much of the price fall may have happened before the crossover.
Why Crossover Signals Lag
Moving averages are calculated from past prices, so crossovers are lagging signals. A fast average must move enough to cross a slower one, which usually happens only after price has already changed direction.
This lag can help filter out minor price fluctuations, but it also means entries may occur well after a move begins. In sideways markets, the averages may cross repeatedly and create false bullish or bearish signals.
For this reason, traders often seek confirmation instead of acting on a crossover alone. They may examine whether price has broken an important support or resistance level, whether the averages are sloping in the crossover direction, whether market structure supports the signal, and whether the higher-timeframe trend agrees.
A crossover is best treated as one piece of evidence. Price position, slope, alignment and nearby support or resistance can provide the context needed to judge whether the signal is meaningful or simply another reaction inside a sideways market.
Confirmation Tools, Limitations, Mistakes and FAQs
Moving averages can make a crypto chart easier to read, but they should not be used in isolation. Traders often compare them with momentum and volume indicators before making a decision.
This does not guarantee a correct signal. Confirmation tools simply provide more context about the price move, trend strength and market participation.
Combining Moving Averages with RSI
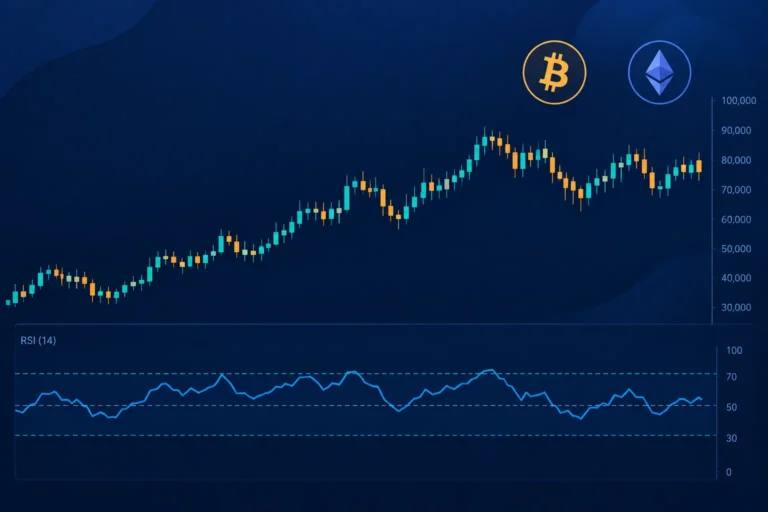
The Relative Strength Index, or RSI, is a momentum indicator. It measures the speed and size of recent price changes, usually on a scale from 0 to 100.
Traders commonly treat an RSI reading above 70 as a sign that an asset may be overbought and a reading below 30 as a sign that it may be oversold. These are warning areas, not automatic reversal signals. During a strong crypto trend, RSI can remain high or low for a long time.
Suppose Bitcoin is trading above a rising 50-period moving average. This suggests an upward trend. If RSI is also strengthening, it may add evidence that buyers have momentum. However, if the price rises while RSI weakens, a trader may become more cautious.
Beginners who want to understand these signals in more detail can study the RSI Indicator in Crypto Trading. The main point is to use RSI as supporting evidence rather than as proof of what the price will do next.
Combining Moving Averages with MACD
MACD stands for Moving Average Convergence Divergence. It is a trend and momentum indicator calculated using exponential moving averages. It usually includes a MACD line, a signal line and a histogram.
A trader may compare an SMA or EMA trend signal with MACD. For example, if Ether moves above a key moving average while the MACD line also crosses above its signal line, the two indicators may point in the same bullish direction.
However, MACD is also based on past price data. Using MACD with another moving average does not remove lag, and both tools can produce misleading signals in a sideways market.
Combining Moving Averages with Trading Volume
Trading volume shows how much of a cryptocurrency was traded during a selected period. It can help traders assess the level of participation behind a price move.
For example, a breakout above the 200-period SMA accompanied by relatively strong volume may receive more attention than a breakout on weak volume. Higher volume can suggest that more market participants are involved. It still does not ensure that the breakout will continue.
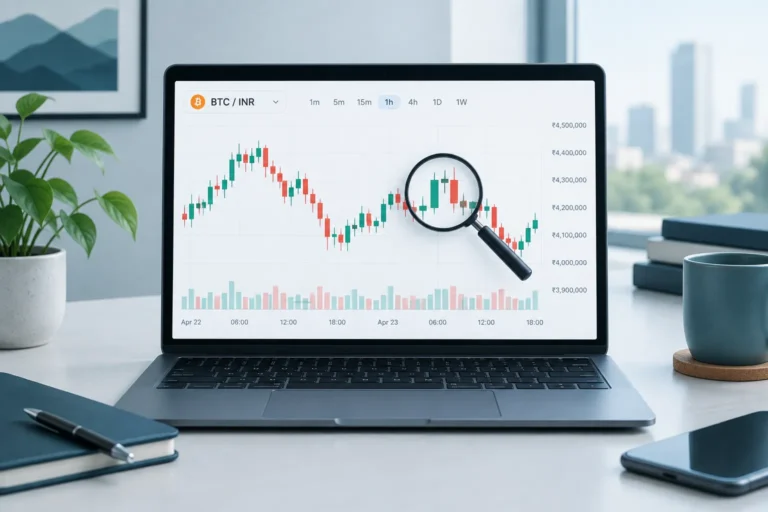
Volume data may also vary between crypto exchanges. Traders should check which market and trading pair the chart represents. A BTC/INR chart on one exchange may show different volume from a BTC/USDT chart on another.
Indicators cannot replace basic research. Before trading, consider the project, liquidity, token supply, security risks and major announcements. A structured guide such as How to Research a Cryptocurrency Before Trading can help beginners look beyond the chart.
Limitations of Moving Averages in Crypto
The main weakness of moving averages crypto traders should understand is that they use historical prices. They react after the market has already moved rather than predicting the next move with certainty.
- Lag: An SMA or EMA may confirm a trend only after part of the move has occurred. Longer periods generally react more slowly.
- Whipsaws: The price may repeatedly cross above and below a moving average, creating several losing or confusing signals.
- False crossovers: A short-term average can cross a long-term average and then quickly reverse. Not every crossover develops into a lasting trend.
- Timeframe sensitivity: A coin may look bullish on a 15-minute chart but bearish on a daily chart. The signal depends heavily on the selected timeframe.
- News-driven moves: Regulation, exchange problems, security breaches or major project announcements can cause sudden price changes before an indicator can respond.
- Sideways-market weakness: Moving averages often perform poorly when price moves within a narrow range. Frequent crossings can create false entries and exits.
An EMA reacts faster than an SMA, but faster is not always better. The extra sensitivity can produce earlier signals as well as more market noise. Traders must balance responsiveness against stability.
Common Mistakes to Avoid
- Using one indicator alone: A moving average cannot show every relevant factor. Consider trend, momentum, volume, market structure and risk.
- Treating the line as an exact price: Moving averages may act as zones of support or resistance, but price can move above or below them temporarily.
- Changing settings to fit the past: Repeatedly adjusting periods until they look perfect on an old chart can create unrealistic confidence. Past fit does not prove future usefulness.
- Ignoring costs and risk: Frequent trading can involve exchange fees, spreads, slippage and taxes. A seemingly profitable chart signal may be less attractive after costs.
- Mixing timeframes carelessly: A crossover on a five-minute chart should not be interpreted in the same way as a crossover on a weekly chart. Define the trading timeframe first.
- Assuming every crossover is a trade: A crossover is an observation, not a guaranteed buy or sell instruction. Check the wider trend and decide in advance how much loss you can accept.
Beginners can review educational explanations in TradingView documentation and established technical-analysis education resources. These can clarify calculations and chart settings, but no educational source can make an indicator consistently accurate.
Frequently Asked Questions
1. Is SMA or EMA better for crypto?
Neither is always better. An SMA is smoother and may suit traders who want a clearer view of the broader trend. An EMA reacts faster and may suit traders who give more importance to recent prices. The choice depends on the timeframe, strategy and tolerance for false signals.
2. Which moving average period should a beginner use?
There is no universal best period. Beginners often study commonly watched periods such as 20, 50, 100 and 200 to understand different trend lengths. Test one or two consistent settings instead of frequently changing them to match past charts.
3. What does a 200-period moving average mean?
It represents the average price over the previous 200 candles. On a daily chart, it uses 200 daily candles. On an hourly chart, it uses 200 hourly candles. Traders often use it to assess the longer-term trend.
4. Do moving averages predict crypto prices?
No. They summarise past prices and can help identify trend direction. They cannot predict future prices or account for unexpected news, liquidity changes and shifts in market sentiment.
5. Do moving averages work in sideways markets?
They are usually less reliable when price moves sideways. The price and moving averages may cross repeatedly, producing whipsaws and false signals. Recognising the market condition is therefore important.
6. How should Golden Cross and Death Cross signals be interpreted?
A Golden Cross occurs when a shorter moving average crosses above a longer one and is generally viewed as bullish. A Death Cross occurs when the shorter average crosses below and is generally viewed as bearish. Both are lagging signals and should be checked against price structure, volume and the selected timeframe.
7. Can moving averages be used on intraday crypto charts?
Yes. Traders can apply them to minute or hourly charts, but shorter timeframes often contain more noise and false signals. Fees, spreads, slippage and rapid price changes also matter more when trades are frequent.
8. Should moving averages be combined with other indicators?
They can be combined with tools such as RSI, MACD and trading volume for additional context. Avoid adding too many similar indicators, because several indicators based on the same price data may provide repetitive rather than independent confirmation.
Summary
Moving averages help organise price data and identify possible trends, but they lag and can fail during volatile or sideways conditions. RSI may add momentum context, MACD may offer another view of trend and momentum, and volume may show participation behind a move. None of these tools guarantees accuracy.
Avoid treating moving-average crossovers or support and resistance levels as certain outcomes. Use consistent settings, match the indicator to the correct timeframe, consider trading costs and manage risk before entering any position.
Risk disclaimer: Cryptocurrency trading is highly volatile, and losses are possible. Moving averages and other indicators can fail or produce false signals. This article is for educational purposes only and is not financial advice.

Comments